Cloud Native Foundation - Overview
基本概念
- 在包括公有云、私有云、混合云等动态环境中构建和运行规模化应用的能力
- 云原生是一种思想,是技术、企业管理方法的集合
- 技术层面
- 应用程序从设计之初就为在云上运行而做好准备
- 云平台基于自动化体系
- 流程层面
- 基于 DevOps CI/CD
- 技术层面
- 基于多种手段
- 应用容器化封装
- 服务网格
- 不可变基础设施
- 声明式API - 核心 + 标准
- 意义
- 提升系统的适应性、可管理性、可观测性
- 使工程师能以最小成本进行频繁和可预测的系统变更
- 提升速度和效率,助力业务成长,缩短I2M(Idea to Market)
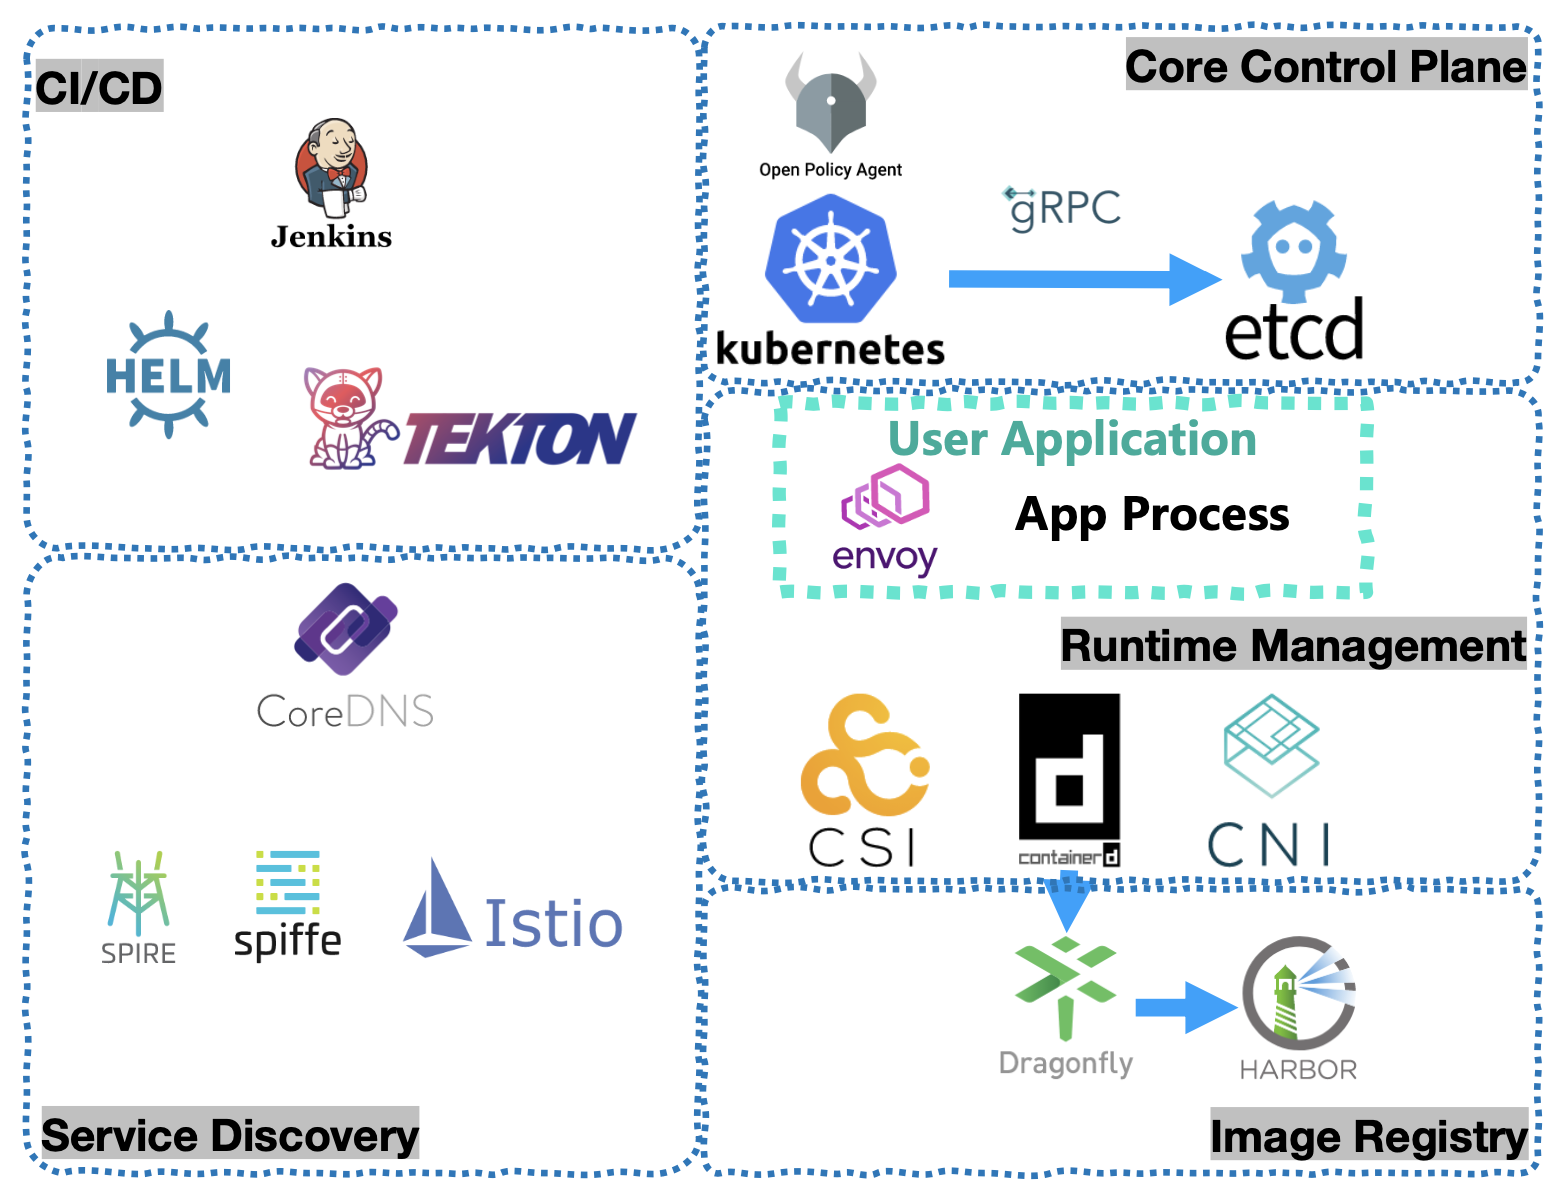
核心项目
All articles on this blog are licensed under CC BY-NC-SA 4.0 unless otherwise stated.
Related Articles

2022-03-19
Go Engineering - Specification - Commit
规范化的优势 优势:Commit Message 可读性更好 + 自动化 清晰地知道每个 Commit 的变更内容 基于 Commit Message 进行过滤查找:git log --oneline --grep "^feat|^fix|^perf" 基于 Commit Message 生成 Change Log 基于 Commit Message 触发 CICD 流程 确定语义化版本的版本号 fix 类型映射为 PATCH 版本 feat 类型映射为 MINOR 版本 带有 BREAKING CHANGE 的 Commit 映射为 MAJOR 版本 Angular 规范 Angular 格式清晰,使用最为广泛;Angular 规范是一种语义化的提交规范 Commit Message 是语义化的 Commit Message 都会被归为一个有意义的类型,用来说明本次 Commit 的类型 Commit Message 是规范化的 Commit Message 遵循预先定义好的规范,可以被开发者和工具识别 样例 规范 Commit Message 组成部分:...
2024-10-13
Observability - Concept
概述 可观测性 - 从系统向外部输出的信息来推断出系统内部状态的好坏 可观测强调的是一种度量能力 在不发布新代码(如新增诊断日志)的情况下理解系统内部状态 - 系统具有可观测性 Metrics + Logs + Tracing Metrics + Logs + Tracing 只是遥测数据类型,而 Observability 并非具体技术,而是系统属性,类似于 HA Key Desc Metrics 在一段时间内测量的数值,默认是结构化的,便于查询和存储优化 Logs 对特定时间发生的事件的文本记录,一般是非结构化字符串,会在程序执行期间被写入磁盘 Tracing 表示请求通过分布式系统的端到端的路径,执行的每个操作被称为 Span Tracing 一般会通过可视化的瀑布图展现出来 Metrics 由于 Metrics 最大的特点是聚合性 Metrics 生成的数值是反映预定义时间段内系统状态的汇总报告 - 缺乏颗粒度 Metrics 之间可能彼此不相关 Metrics 常用于 - 静态仪表盘的构建、随时间变化的趋势分析、监控维度是否保持在定义的阈值内 但都...
2022-11-08
Kubernetes - Cgroups
Namespace 隔离不完备 在 Linux 内核中,有很多资源和对象是不能被 Namespace 化的,例如时间 如果在容器中使用 settimeofday(2) 的系统调用,整个宿主机的时间都会被修改 Cgroups 在 Linux 中,Cgroups 暴露给用户的操作接口是文件系统 1234567891011121314151617181920$ mount -t cgroupcgroup on /sys/fs/cgroup/systemd type cgroup (rw,nosuid,nodev,noexec,relatime,xattr,name=systemd)cgroup on /sys/fs/cgroup/blkio type cgroup (rw,nosuid,nodev,noexec,relatime,blkio)cgroup on /sys/fs/cgroup/cpu,cpuacct type cgroup (rw,nosuid,nodev,noexec,relatime,cpu,cpuacct)cgroup on /sys/fs/cgroup/devices typ...

2023-02-02
Kubernetes - Security
层次模型 开发 分发 部署 运行时 容器运行时Non-root 在 Dockerfile 中通过 USER 命令切换成非 root 用户 防止某些镜像窃取宿主的 root 权限并造成危害 在某些容器运行时,容器内部的 root 用户与宿主上的 root 用户是同一个用户 宿主上的重要文件被 mount 到容器内,并被容器修改配置 即使在容器内部也应该权限隔离 123FROM ubuntuRUN user add AUSER A User namespace 依赖 User namespace,任何容器内部的用户都会映射为宿主上的非 root 用户 默认关闭,因为会引入配置复杂性 系统不知道宿主用户与容器用户的映射关系,在 mount 文件时无法设置适当的权限 Rootless container 容器运行时以非 root 身份启动 即使容器被攻破,在宿主层面获得的用户权限也是非 root 用户 Docker 和其它容器运行时本身的后台 Daemon 需要以 root 身份运行,其它的用户容器才能以 rootless 身份运行 某些运行时,如 Podman,没有 Daemon 进程,...
2023-01-31
Kubernetes - Istio
CRD 核心为 networking 12345678910111213141516171819202122$ istioctl versionclient version: 1.19.3control plane version: 1.19.3data plane version: 1.19.3 (2 proxies)$ k get crdNAME CREATED ATauthorizationpolicies.security.istio.io 2022-12-27T02:58:37Zdestinationrules.networking.istio.io 2022-12-27T02:58:37Zenvoyfilters.networking.istio.io 2022-12-27T02:58:37Zgateways.networking.istio.io 2022-12-27T02:58:37Zistiooperators.install.istio.io...

2021-07-08
Kubernetes -- Pod + 容器设计模式
基本概念容器 ► Pod ► Kubernetes 容器:一个视图被隔离、资源受限制的进程 容器 PID=1 的进程为应用本身(管理容器 = 管理应用) Pod:进程组 Kubernetes:操作系统 容器镜像:软件安装包 进程组 容器是单进程模型(容器 == 应用 == 进程,只能管理 PID=1 的进程,并不是说容器内只能运行一个进程) 容器内 PID=1 的进程为应用进程,本身不具备进程管理能力 如果将 PID=1 的进程改为 systemd,导致:管理容器 = 管理systemd != 管理应用 因此需要引入 Pod 原子调度单位紧密协作:必须部署在同一台机器上并共享某些信息 关系 亲密关系 – 调度解决 两个应用(Pod)需要运行在同一台宿主机上 超亲密关系 – Pod 解决 会发生直接的文件交换 使用 localhost 或者 Socket 文件进行本地通信 会发生非常频繁的 RPC 调用 会共享某些 Linux Namespace 实现机制解决的...