Kubernetes - Scaling
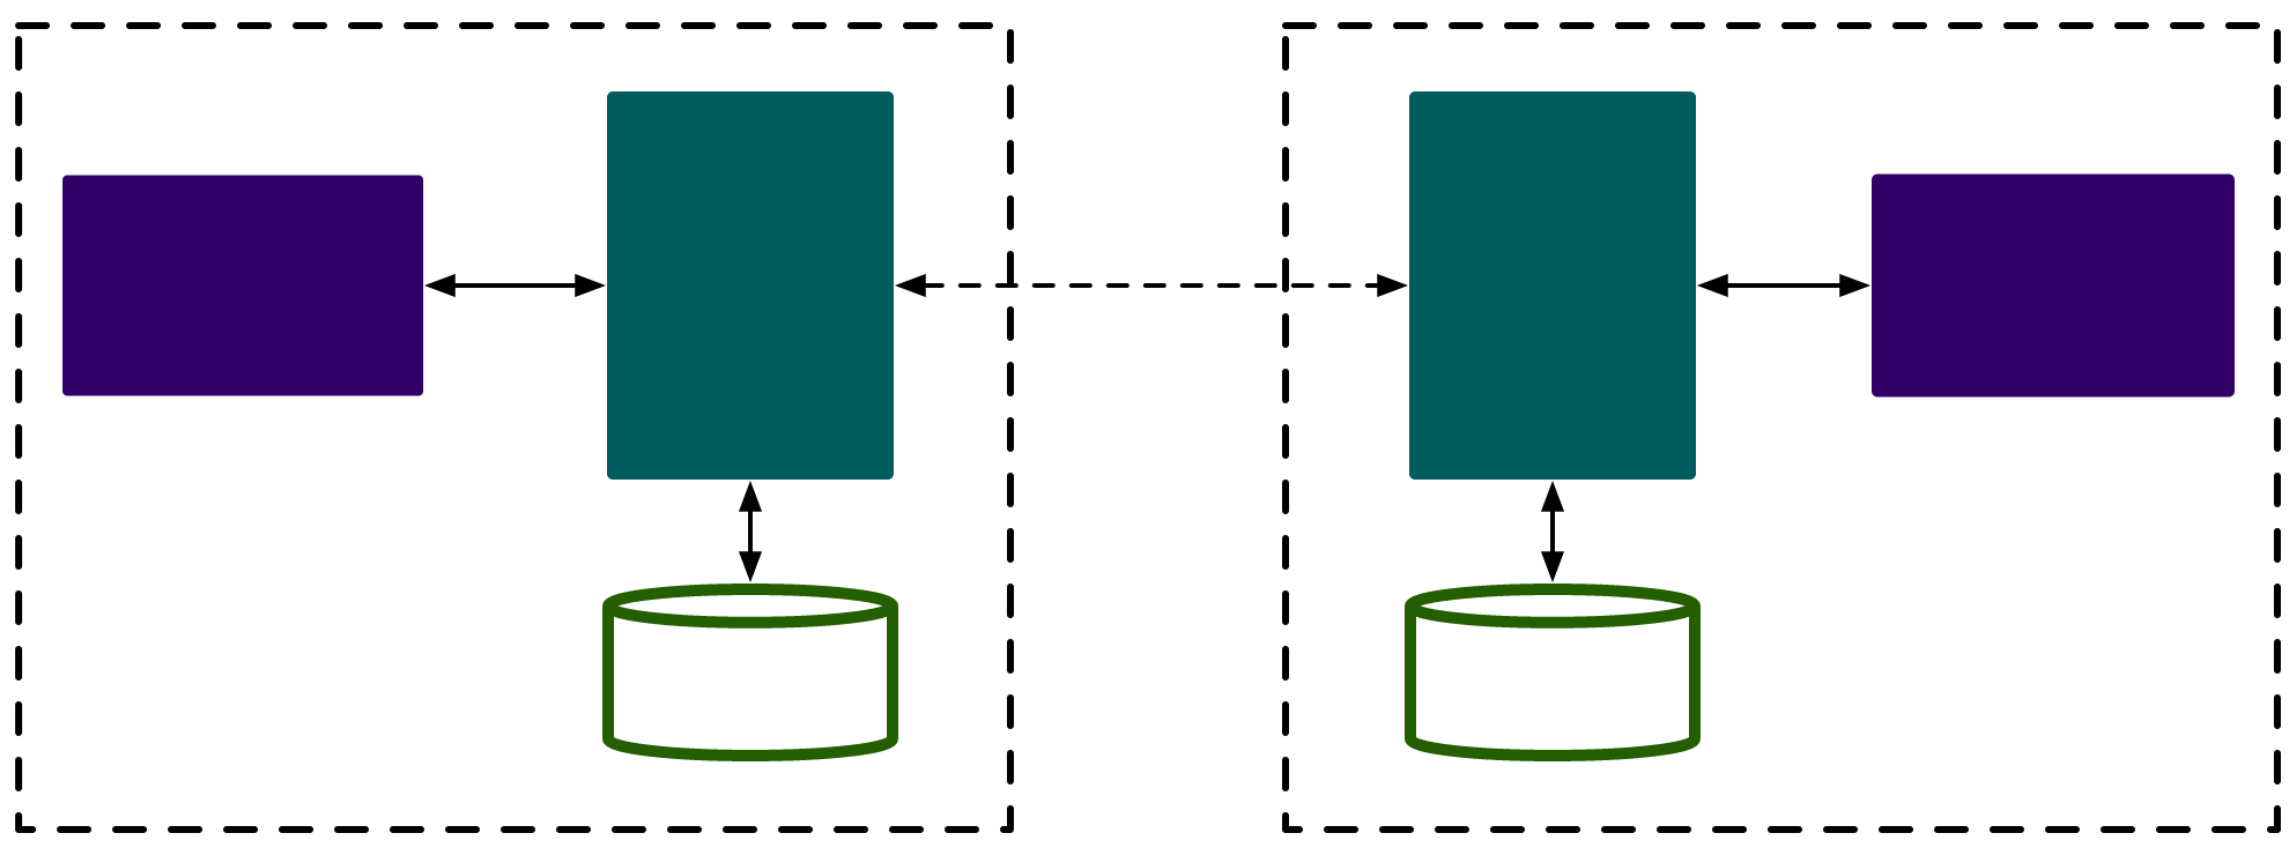
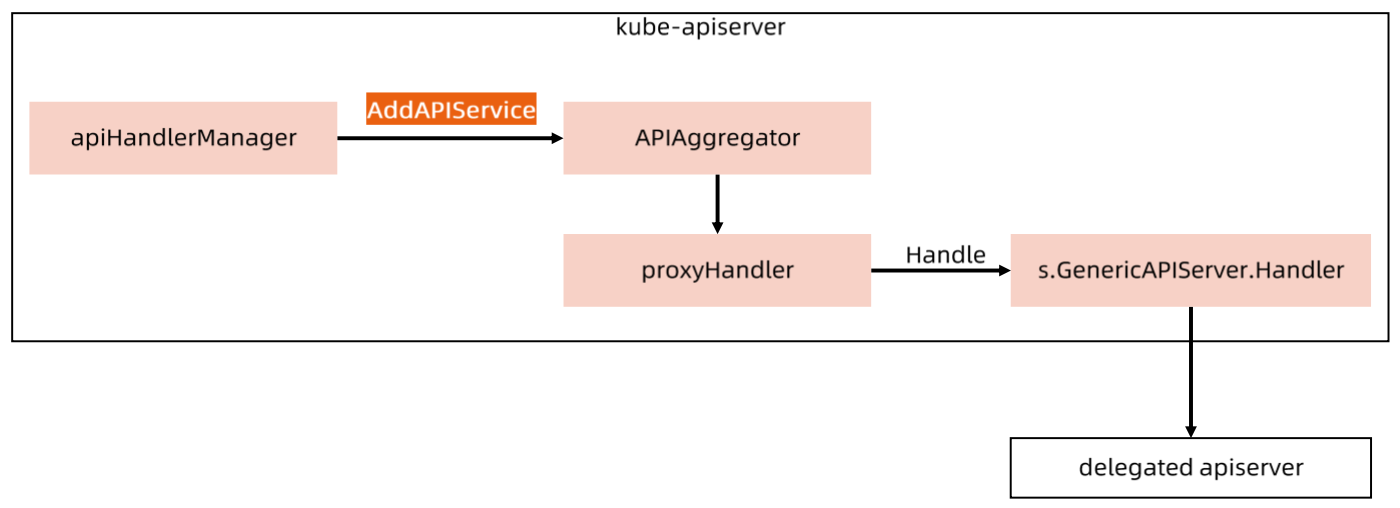
Aggregated APIServer
1 | $ k get apiservices.apiregistration.k8s.io |
Metrics-Server
Metrics-Server 遵循 API Server 的标准,并以
Aggregated APIServer的形式工作
Metrics-Server是 Kubernetes监控体系中的核心组件之一- 负责从
kubelet收集资源指标,然后对这些指标监控数据进行聚合(kube-aggregator) - 并在
API Server中通过Metrics API(/apis/metrics.k8s.io/) 暴露
- 负责从
- Metrics-Server 只存储
最新的指标数据(CPU/Memory) - 几点注意
- API Server 能访问 Metrics-Server
- 需要在 API Server 启用
聚合层 - 组件要有
认证配置并且绑定到 Metrics-Server - Pod / Node 指标需要由
Summary API通过kubelet公开
k get apiservices.apiregistration.k8s.io v1beta1.metrics.k8s.io -oyaml
1 | apiVersion: apiregistration.k8s.io/v1 |
如果访问
v1beta1.metrics.k8s.io,则转交给kube-system/metrics-server来处理
1 | $ k get svc -n kube-system |
top
1 | $ k top pod -n kube-system |
k get –raw “/api/v1/nodes/minikube/proxy/metrics/resource”
- kubelet 和 cAdvisor 已经暴露了当前节点上的资源用量
- metrics-server 执行 top 命令无非就是请求对应节点上的资源用量,然后
内存中做聚合排序
1 | # HELP container_cpu_usage_seconds_total [ALPHA] Cumulative cpu time consumed by the container in core-seconds |
运行机制
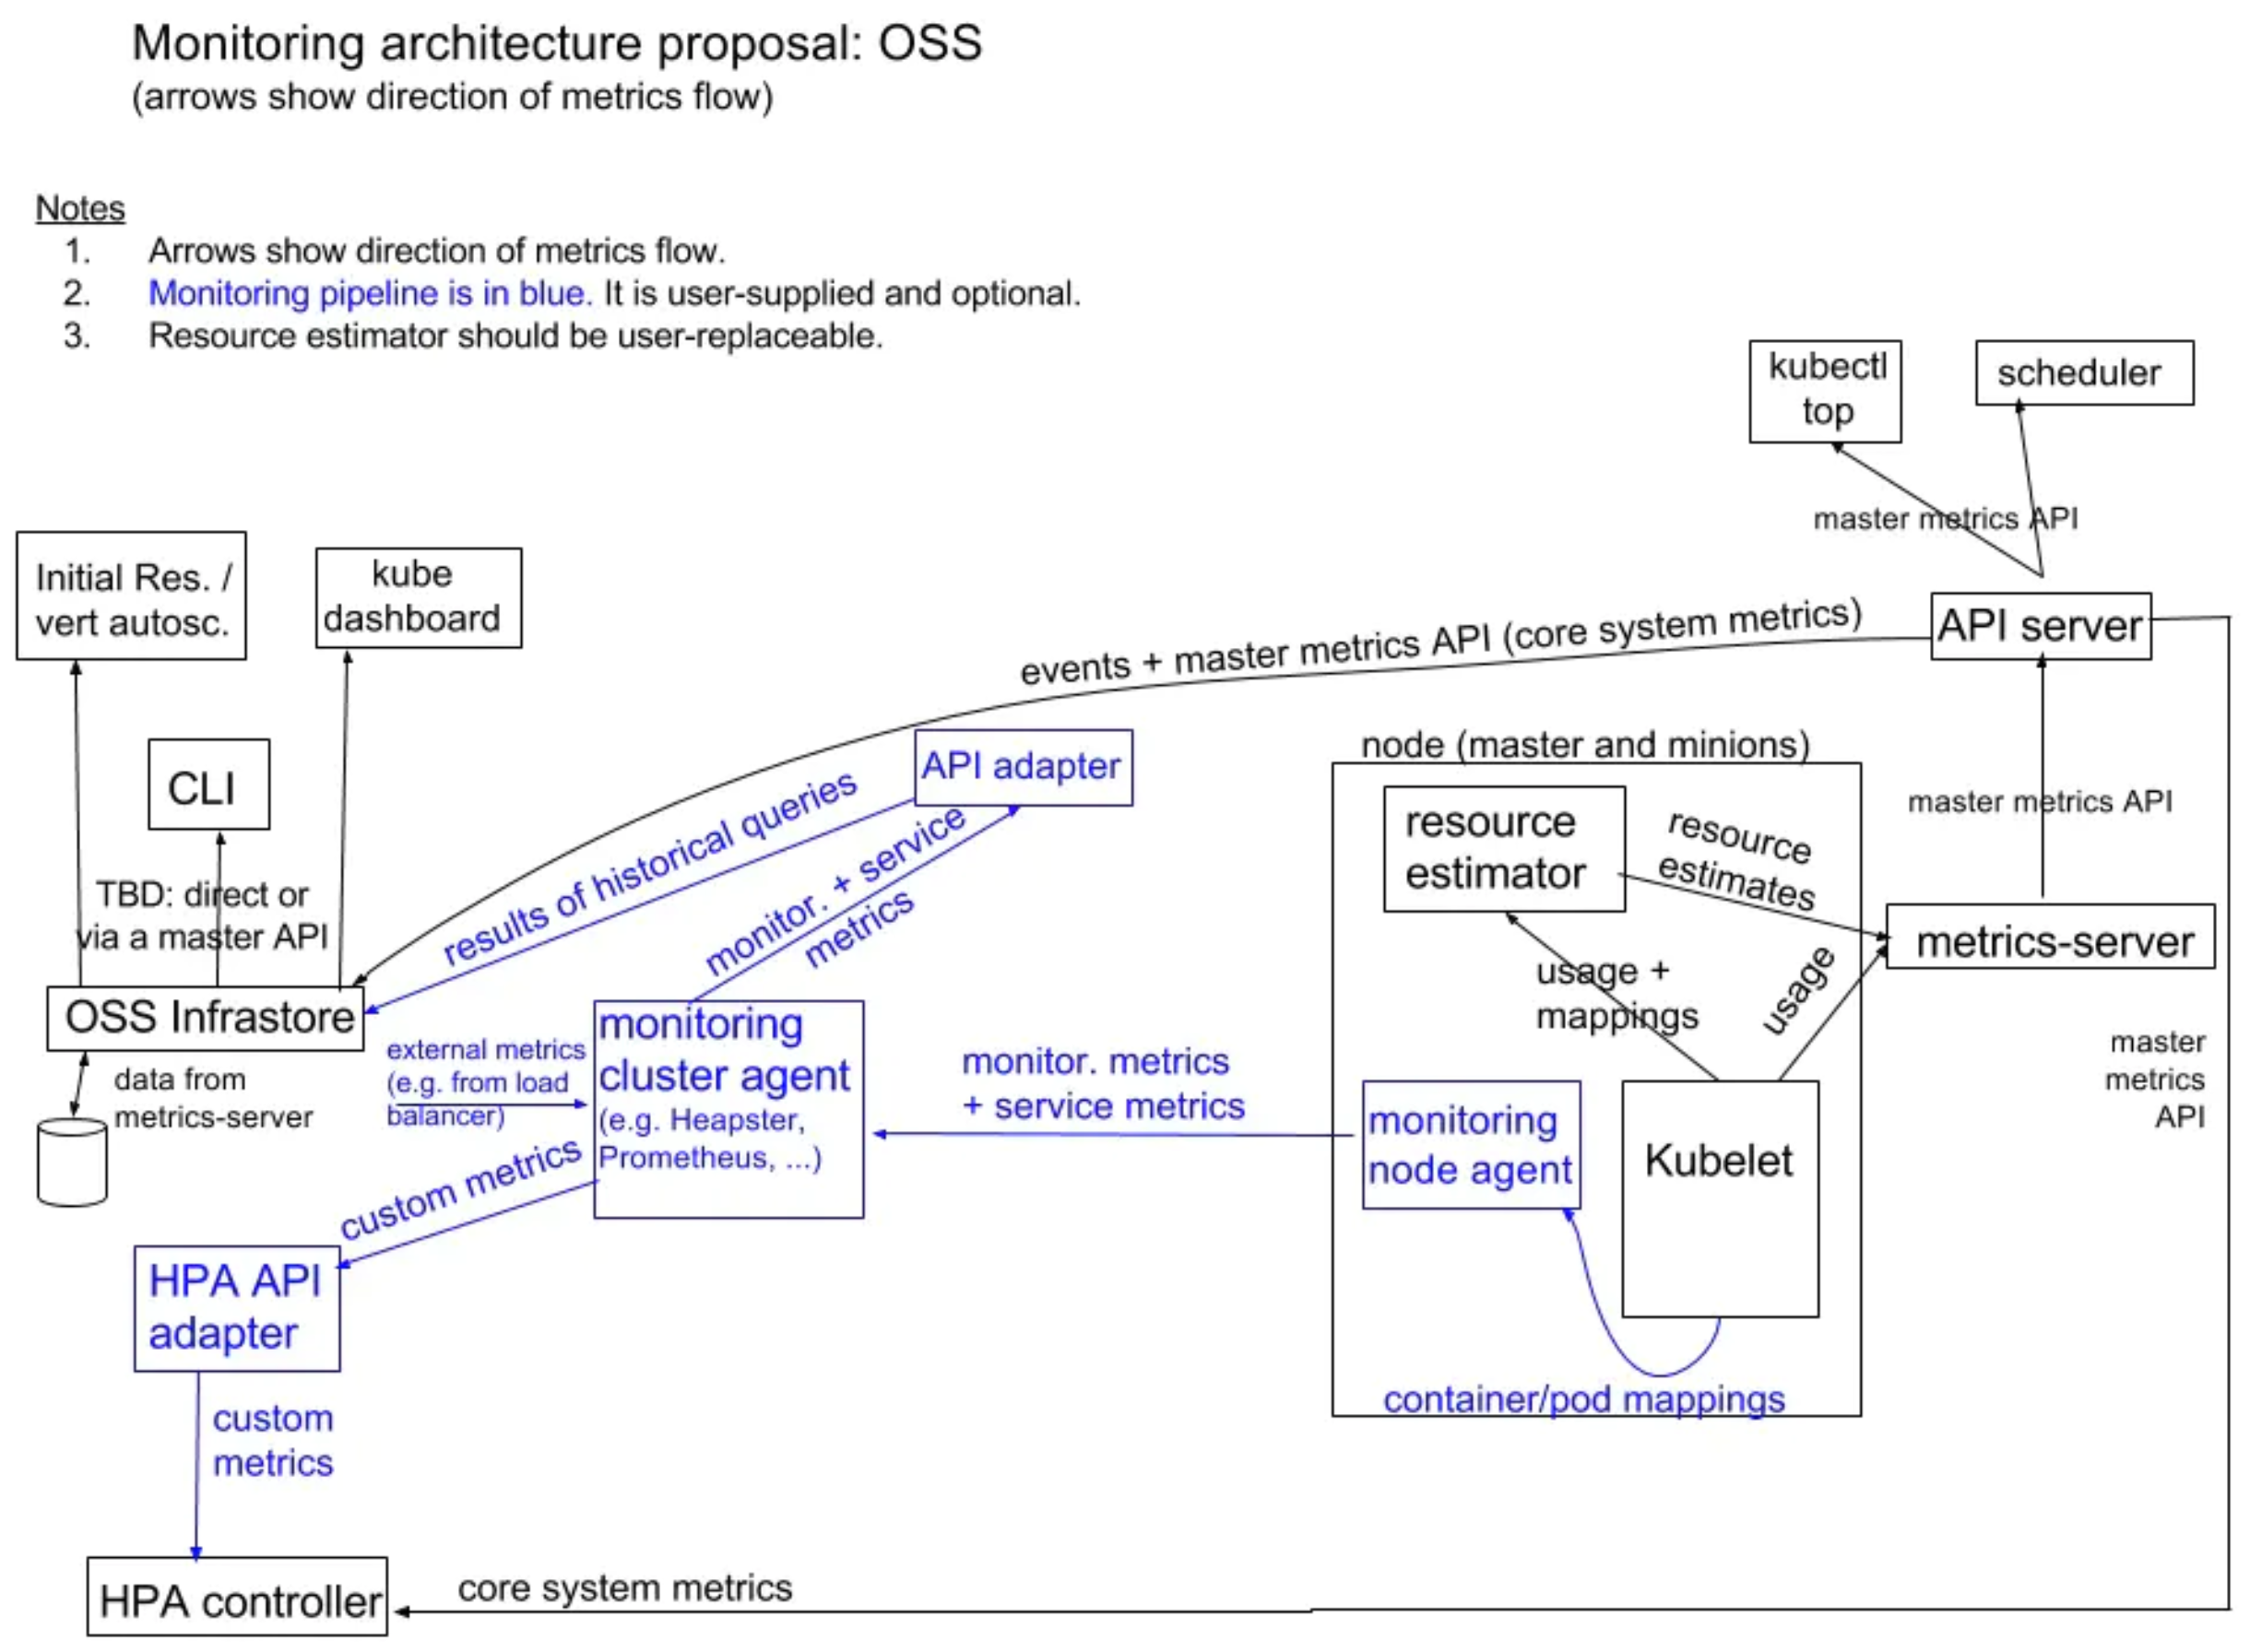
HPA 和 VPA 依赖于 Metrics Server
Scaling
| Scaling | Desc |
|---|---|
| 横向伸缩 | 增加应用实例数量 |
| 纵向伸缩 | 增加单个应用实例资源 |
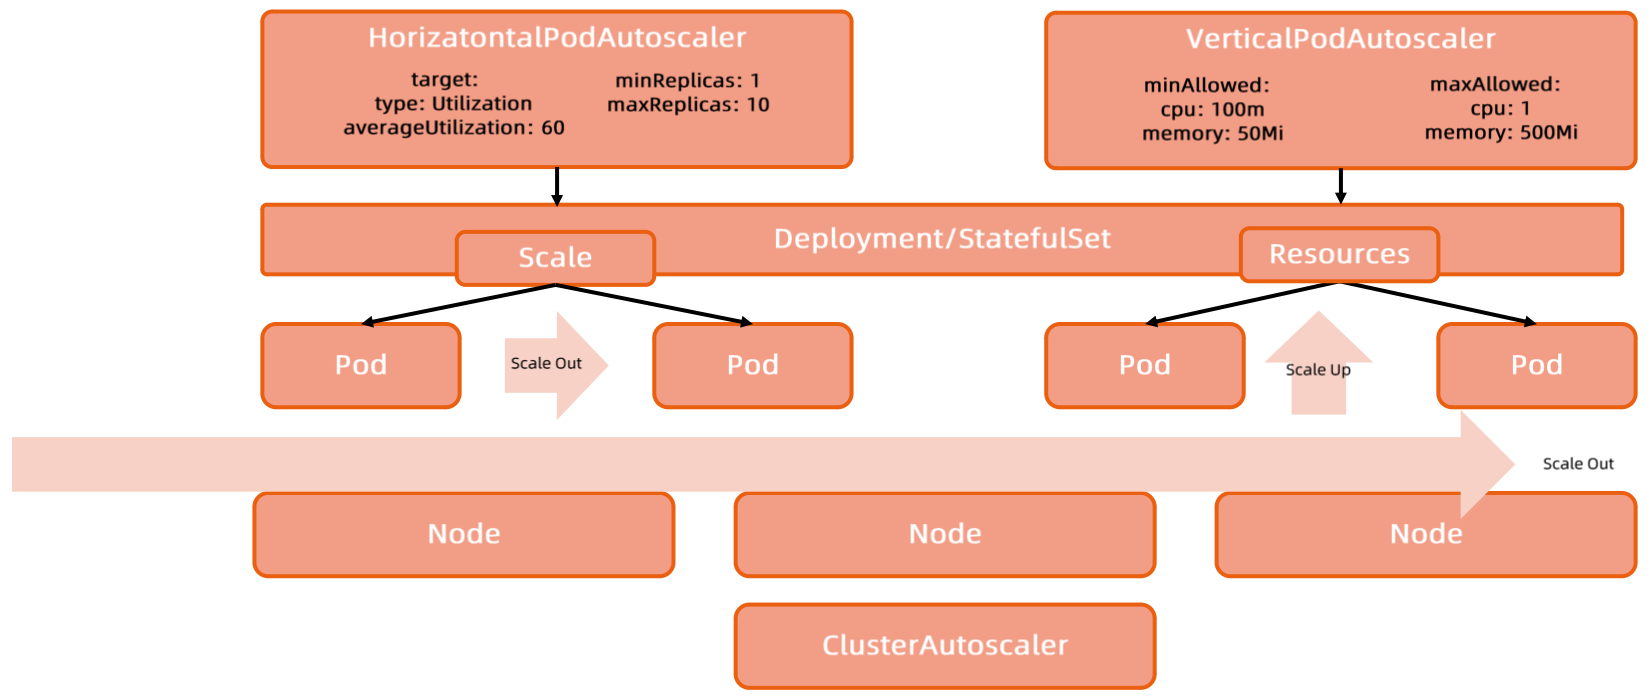
Cluster Autoscaler需要与云厂商集成,很难形成统一的生产化方案
HPA
概述
HorizontalPodAutoscaler
- HPA 是 Kubernetes 的一种资源对象
- 能够根据
特定指标对在 StatefulSet、ReplicaSet、Deployment 等集合中的 Pod 数量进行横向动态伸缩
- 能够根据
- 当
Node 计算资源固定,且 Pod 调度完成并运行后,动态调整计算资源比较困难,因此 HPA 是 Scaling 的第一选择 - 多个
冲突的 HPA同时应用到同一个应用时,可能会发生无法预期的行为 - HPA 依赖于
Metrics-Server
版本
HPA v1,处于毕业状态,但扩展性较弱(只支持 CPU 和 Memory),衍生出了 v2
1 | apiVersion: autoscaling/v1 |
HPA v2
1 | apiVersion: autoscaling/v2beta2 |
指标
- 按 Pod 统计的
Resource 指标(如 CPU)- 控制器从资源指标 API 获取每个 HPA 指定的 Pod 的
度量值 - 如果设置了
目标使用率,控制器获取每个 Pod 中的容器资源使用情况,并计算资源使用率 - 如果设置了
目标值,则直接使用原始数据
- 控制器从资源指标 API 获取每个 HPA 指定的 Pod 的
- 使用 Pod 的
自定义指标,只使用原始值
Resource
1 | metrics: |
httpd
1 | apiVersion: apps/v1 |
1 | $ k apply -f httpd.yaml |
hpa
1 | apiVersion: autoscaling/v2 |
1 | $ k apply -f hpa-httpd.yaml |
load
1 | $ kubectl run -i --tty load-generator --rm --image=busybox --restart=Never -- /bin/sh -c "while sleep 0.001; do wget -q -O- http://httpd; done" |
scaling
1 | $ k get hpa |
关闭压力后,Pod 会慢慢回收
1 | $ k get hpa |
1 | $ k get hpa |
自定义
Metrics-Server
默认不收集,需要通过Aggregated APIServer实现 Metrics-Server 类似的能力
1 | metrics: |
外部
TBD,Metrics-Server 同样默认不收集
算法
期望副本数 = ceil[ 当前副本数 × (当前指标 / 期望指标) ]
- 目标设定值为 100m
- 当前度量值为 200m,那么因子为 2
- 当前度量值为 50m,那么因子为 0.5
- 当因子
接近1.0,则放弃本身 Scaling- 由参数
--horizontal-pod-autoscaler-cpu-initialization-period控制,默认为0.1
- 由参数
Deployment
- 为每个 Deployment 配置一个 HPA
- HPA 管理的是 Deployment 的
replicas字段 -职责清晰
防抖
- 抖动:因为指标动态变化而造成副本数量的频繁变化
--horizontal-pod-autoscaler-downscale-stabilization- 缩容冷却时间窗口长度,默认为5 分钟
策略
当指定
多个策略时,默认选择允许变更最多的策略
1 | behavior: |
问题
突发流量,还未完成弹性扩容,现有服务实例已经被流量击垮
- 由于弹性控制器的
操作链路过长,基于指标的弹性有滞后效应 - 时间差:应用负载超过阈值 -> HPA 完成扩容
- 应用指标数据超过阈值
- HPA
定期执行指标收集 - HPA 控制
Deployment进行扩容的时间 Pod 调度,运行时启动挂载存储和网络的时间应用启动到服务就绪的时间
VPA
尚未
生产就绪
概述
- 根据
容器资源使用率自动设置 CPU 和 Memory 的requests - 可以缩小过度请求资源的容器,也可以根据使用情况随时提升容器的资源容量
- 意义
- Pod 资源
用其所需,提升集群节点使用效率 - 不需要通过
基准测试来确定 CPU 和 Memory 的requests合适值 - 可以
自动调整CPU 和 Memory 的requests,减少运维时间
- Pod 资源
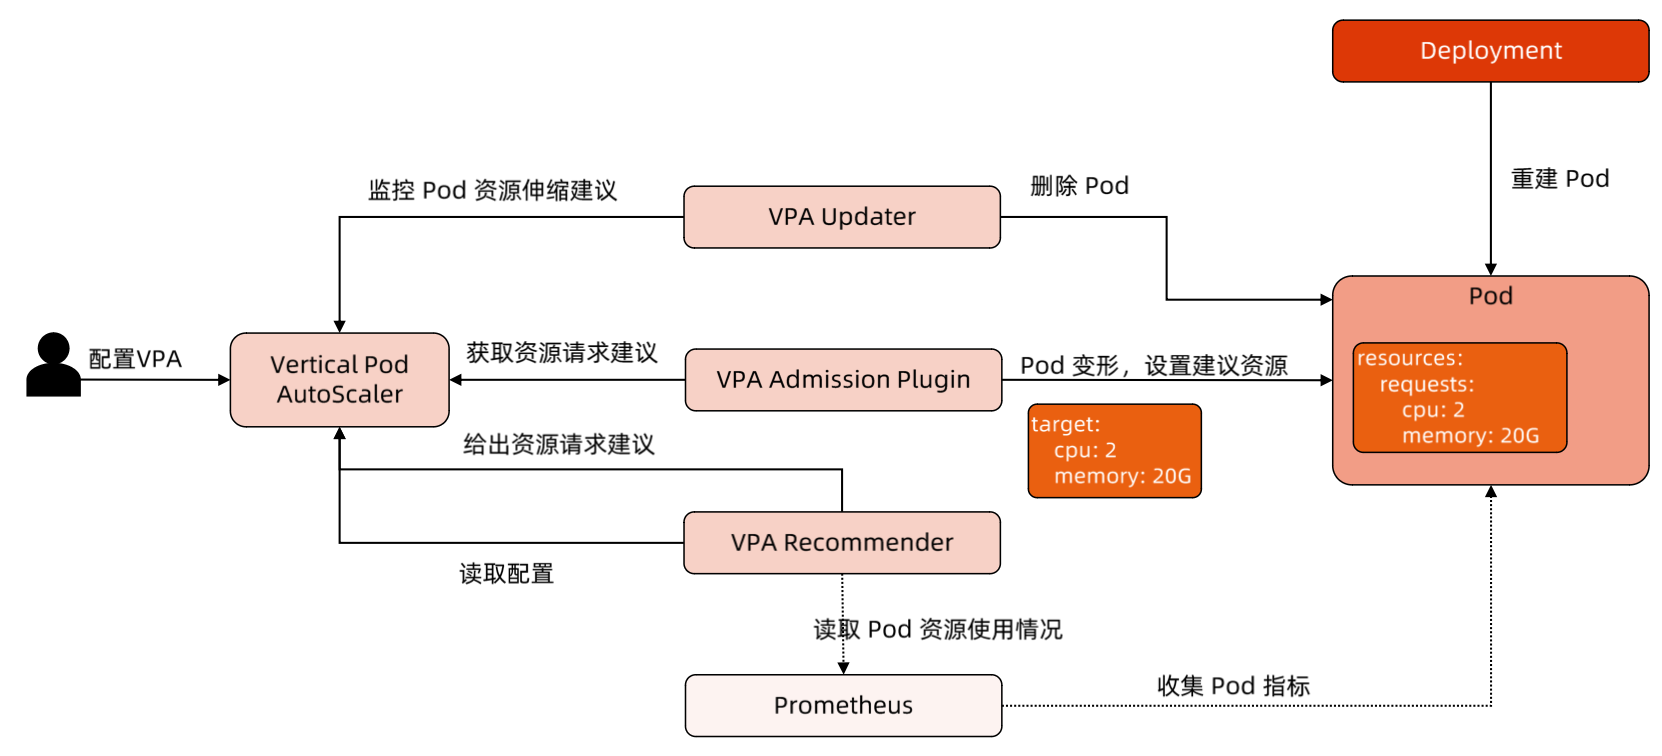
架构
同样需要
驱逐 Pod,并非原地调整,属于破环性操作
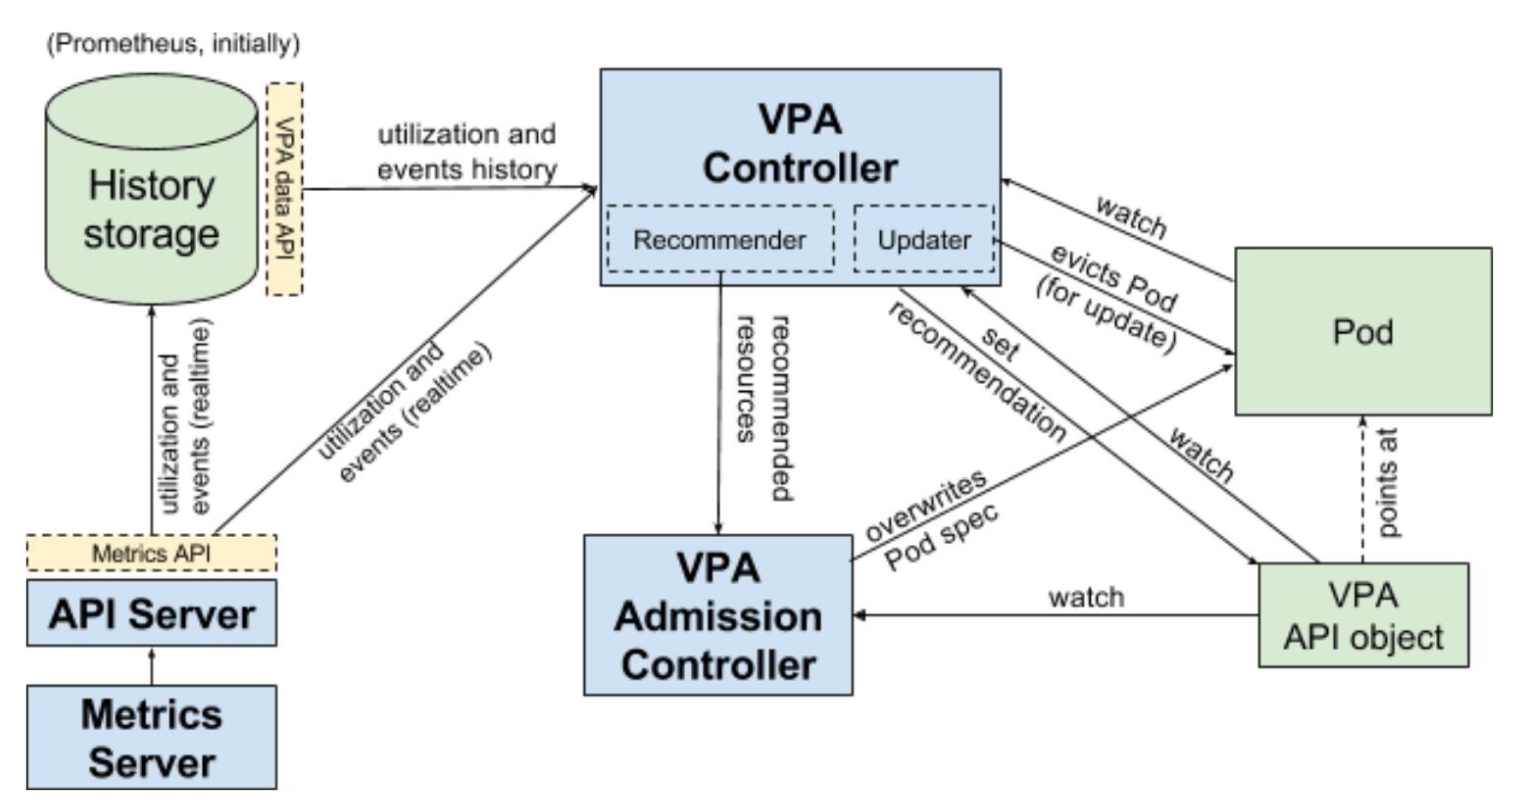
组件
VPA 模式:
Off/Auto
- VPA 引入新的 API 资源
VerticalPodAutoscaler - History Storage
- 持久化来自于
API Server的Pod 利用率和OOM事件 - 后续提供信息给Recommender
- 持久化来自于
- VPA
Recommender- 监视所有的 Pod,不断为它们计算新的
推荐资源,并将值存储在VPA 对象中 - 数据源:来自于 Metrics-Server 的
Pod 利用率和OOM事件(实时+历史)
- 监视所有的 Pod,不断为它们计算新的
- VPA
Updater- 负责 Pod 的实时更新,在 VPA 的
Auto 模式下,Updater 可以决定使用推荐资源对 Pod 进行更新
- 负责 Pod 的实时更新,在 VPA 的
- 所有
Pod 创建请求都需要通过VPA Admission Controller,将 Pod Spec重写为推荐资源
原理
模型
假设 CPU 和 Memory 利用率是
独立随机变量,其分布为过去 N=8 天观察到的变量,依据直方图百分位给推荐
- CPU
- 以历史数据的
95%分位给建议 - CPU 使用率:在短时间间隔内测量的平均使用率,最小合理分辨率为
1/min,推荐为1/sec
- 以历史数据的
- Memory
- 24 小时内有
99%的时间,内存请求不会超过阈值 - 窗口必须很长(>= 24h),确保
OOM引起的驱逐不会明显影响推荐结果
- 24 小时内有
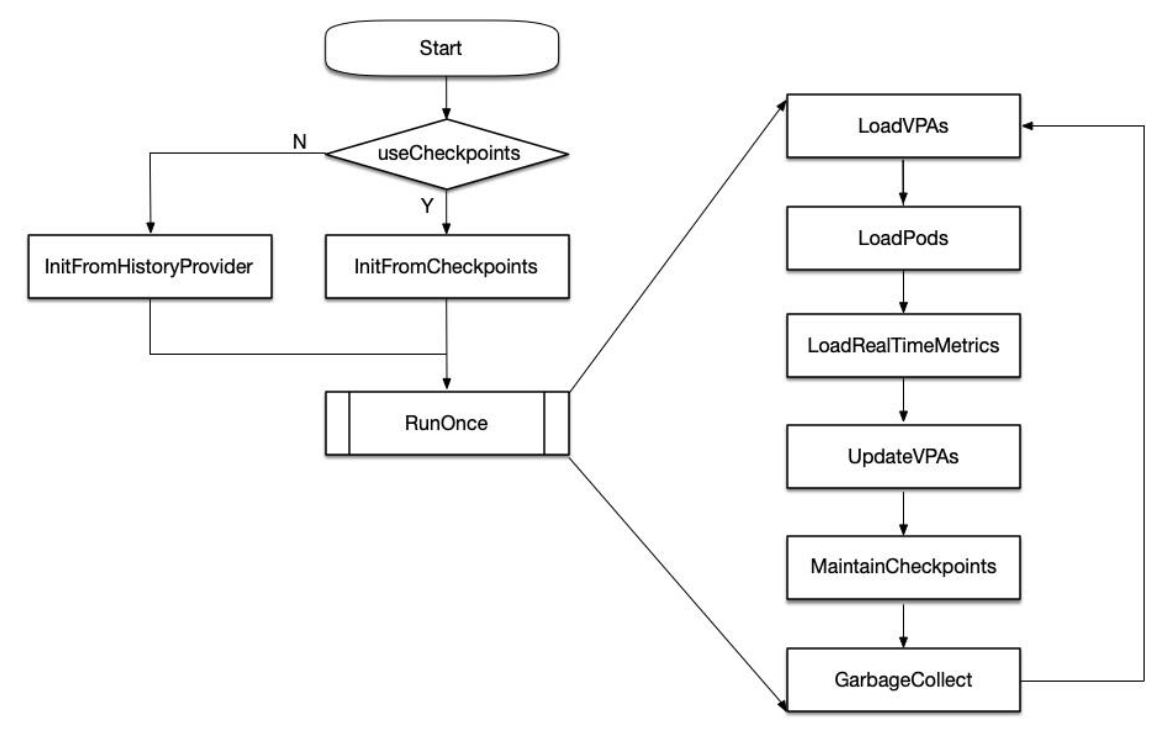
流程:
CheckPoints为内存中的直方图数据结构,History Storage 可能会Crash
半衰指数:
时间越近的数据,权重越大,24 小时为一个半衰期
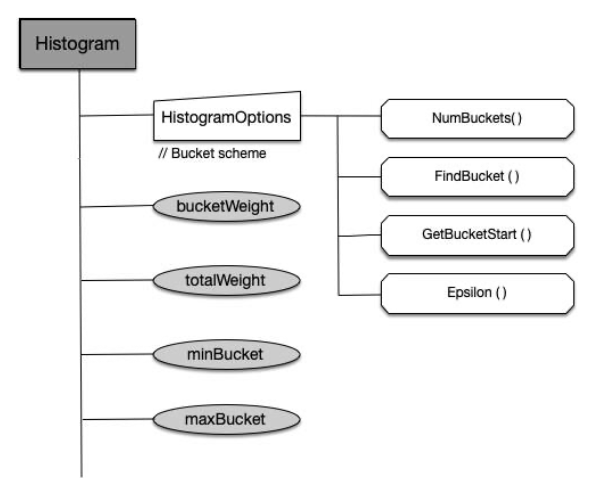
按
指数划分的直方图,数据落到不同的 bucket,且数据本身依据时间远近有不同的权重,最后计算百分位
| Resource | MinBucket | MaxBucket | Rate |
|---|---|---|---|
| CPU | 0.01 cores | 1000 cores | 5% |
| Memory | 10 MB | 1 TB | 5% |
实践
安装 VPA
1 | $ git clone https://github.com/kubernetes/autoscaler.git |
vpa
1 | # This config creates a deployment with two pods, each requesting 100 millicores |
1 | $ k apply -f vpa.yaml |
k get vpa hamster-vpa -oyaml
1 | apiVersion: autoscaling.k8s.io/v1 |
Updater 看到了 Recommender 给出的建议,
重建Pod
1 | $ k get po -w |
VPA Admission Controller
重写了 Pod Spec
但超过了 VPA 的maxAllowed = 1 < 587m + 587m,其中一个 Pod 处于Pending状态
1 | $ Name: hamster-547cf6bd4b-rhttf |
问题
- 更新正在运行的 Pod 资源配置,会导致
Pod 重建,并且可能会被调度到其它节点上 - VPA 不会驱逐没有在
副本控制器管理下的 Pod - VPA 不能与监控
CPU和Memory度量的HPA同时运行,除非 HPA只监控其它自定义或者外部的资源度量 - 需要确保其它的
Admission Webhook不会与 VPA Admission Controller 发生冲突- Admission Webhook 的
执行顺序定义在API Server的配置参数中
- Admission Webhook 的
- VPA 可以处理出现的绝大部分 OOM 事件,但不能保证所有场景都有效
- VPA 尚未有在
大规模集群落地的案例 - VPA 对 Pod 资源 requests 的修改,可能会
超过实际的资源上限(节点资源上限、空闲资源、资源配额等)- 导致 Pod 处于
Pending状态无法被调度,可以结合集群的Cluster AutoScaler一起解决
- 导致 Pod 处于
- 多个 VPA
同时匹配到同一个 Pod 会造成未定义的行为