Observability - Prometheus Introduction
Summary
- Open source metrics and monitoring for your systems and services.
- Monitor your applications, systems, and services with the leading open source monitoring solution.
- Instrument, collect, store, and query your metrics for alerting, dashboarding, and other use cases.
| Feature | Desc |
|---|---|
| Dimensional data model | Prometheus models time series in a flexible dimensional data model. Time series are identified by a metric name and a set of key-value pairs. |
| Powerful queries | The PromQL query language allows you to query, correlate, and transform your time series data in powerful ways for visualizations, alerts, and more. |
| Precise alerting | Alerting rules are based on PromQL and make full use of the dimensional data model. A separate Alertmanager component handles notifications and silencing. |
| Simple operation | Prometheus servers operate independently and only rely on local storage. Developed in Go, the statically linked binaries are easy to deploy across various environments. |
| Instrumentation libraries | Prometheus provides a large number of official and community-contributed metrics instrumentation libraries that cover most major languages. |
| Ubiquitous integrations | Prometheus comes with hundreds of official and community-contributed integrations that allow you to easily extract metrics from existing systems. |
Modern monitoring
- Monitoring for the cloud native world
- Designed for the cloud native world, Prometheus integrates with Kubernetes and other cloud and container managers
- to continuously discover and monitor your services.
- It is the second project to graduate from the CNCF after Kubernetes.
Open Source
- Prometheus is 100% open source and community-driven.
- All components are available under the Apache 2 License on GitHub.
Open Governance
- Prometheus is a Cloud Native Computing Foundation graduated project.
Introduction
Overview
What is Prometheus?
- Prometheus is an open-source systems monitoring and alerting toolkit originally built at SoundCloud.
- Since its inception in 2012, many companies and organizations have adopted Prometheus
- and the project has a very active developer and user community.
- It is now a standalone open source project and maintained independently of any company.
- To emphasize this, and to clarify the project’s governance structure
- Prometheus joined the Cloud Native Computing Foundation in 2016 as the second hosted project, after Kubernetes
- Prometheus collects and stores its metrics as time series data, i.e.
- metrics information is stored with the timestamp at which it was recorded, alongside optional key-value pairs called labels.
Features
Prometheus’s main features are:
- a multi-dimensional data model with time series data identified by metric name and key/value pairs
- PromQL, a flexible query language to leverage this dimensionality
- no reliance on distributed storage; single server nodes are autonomous
- time series collection happens via a pull model over HTTP
- pushing time series is supported via an intermediary gateway
- targets are discovered via service discovery or static configuration
- multiple modes of graphing and dashboarding support
What are metrics?
- Metrics are numerical measurements in layperson terms.
- The term time series refers to the recording of changes over time.
- What users want to measure differs from application to application.
- For a web server, it could be request times;
- for a database, it could be the number of active connections or active queries, and so on.
- Metrics play an important role in understanding why your application is working in a certain way.
- Let’s assume you are running a web application and discover that it is slow.
- To learn what is happening with your application, you will need some information.
- For example, when the number of requests is high, the application may become slow.
- If you have the request count metric, you can determine the cause and increase the number of servers to handle the load.
Components
The Prometheus ecosystem consists of multiple components, many of which are optional:
- the main Prometheus server which scrapes and stores time series data
- client libraries for instrumenting application code
- a push gateway for supporting short-lived jobs
- special-purpose exporters for services like HAProxy, StatsD, Graphite, etc.
- an alertmanager to handle alerts
- various support tools
Most Prometheus components are written in Go, making them easy to build and deploy as static binaries.
Architecture
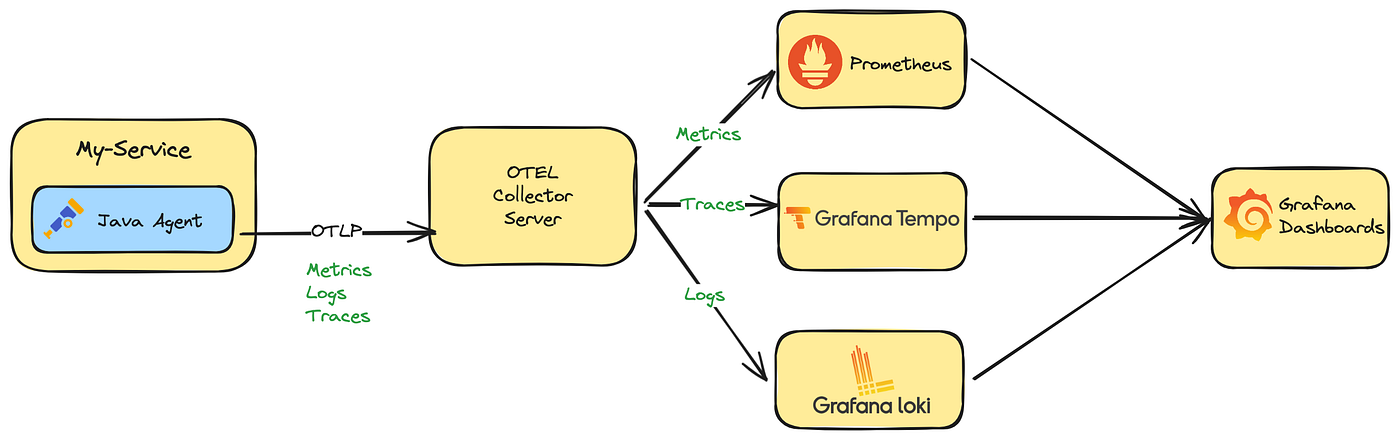
This diagram illustrates the architecture of Prometheus and some of its ecosystem components:

- Prometheus scrapes metrics from instrumented jobs, either directly or via an intermediary push gateway for short-lived jobs.
- It stores all scraped samples locally
- and runs rules over this data to either aggregate and record new time series from existing data or generate alerts.
- Grafana or other API consumers can be used to visualize the collected data.
When does it fit?
- Prometheus works well for recording any purely numeric time series.
- It fits both machine-centric monitoring as well as monitoring of highly dynamic service-oriented architectures.
- In a world of microservices, its support for multi-dimensional data collection and querying is a particular strength.
- Prometheus is designed for reliability, to be the system you go to during an outage to allow you to quickly diagnose problems.
- Each Prometheus server is standalone, not depending on network storage or other remote services.
- You can rely on it when other parts of your infrastructure are broken, and you do not need to setup extensive infrastructure to use it.
When does it not fit?
- Prometheus values reliability. You can always view what statistics are available about your system, even under failure conditions.
- If you need 100% accuracy, such as for per-request billing
- Prometheus is not a good choice as the collected data will likely not be detailed and complete enough.
- In such a case you would be best off using some other system to collect and analyze the data for billing, and Prometheus for the rest of your monitoring.
First steps with Prometheus
- Prometheus is a monitoring platform that collects metrics from monitored targets by scraping metrics HTTP endpoints on these targets.
- This guide will show you how to install, configure and monitor our first resource with Prometheus. You’ll download, install and run Prometheus.
- You’ll also download and install an exporter, tools that expose time series data on hosts and services.
- Our first exporter will be Prometheus itself, which provides a wide variety of host-level metrics about memory usage, garbage collection, and more.
Downloading Prometheus
Download the latest release of Prometheus for your platform, then extract it:
1 | tar xvfz prometheus-*.tar.gz |
The Prometheus server is a single binary called prometheus,We can run the binary and see help on its options by passing the --help flag.
1 | ./prometheus --help |
Configuring Prometheus
- Prometheus configuration is YAML.
- The Prometheus download comes with a sample configuration in a file called prometheus.yml that is a good place to get started.
We’ve stripped out most of the comments in the example file to make it more succinct
1 | global: |
1 | 全局配置 (Global Config) |
- There are three blocks of configuration in the example configuration file: global, rule_files, and scrape_configs.
- The global block controls the Prometheus server’s global configuration.
- We have two options present. The first, scrape_interval, controls how often Prometheus will scrape targets.
- You can override this for individual targets.
- In this case the global setting is to scrape every 15 seconds.
- The evaluation_interval option controls how often Prometheus will evaluate rules.
- Prometheus uses rules to create new time series and to generate alerts.
- We have two options present. The first, scrape_interval, controls how often Prometheus will scrape targets.
- The rule_files block specifies the location of any rules we want the Prometheus server to load. For now we’ve got no rules.
- The last block, scrape_configs, controls what resources Prometheus monitors.
- Since Prometheus also exposes data about itself as an HTTP endpoint it can scrape and monitor its own health.
- In the default configuration there is a single job, called prometheus
- which scrapes the time series data exposed by the Prometheus server.
- The job contains a single, statically configured, target, the localhost on port 9090.
- Prometheus expects metrics to be available on targets on a path of /metrics.
- So this default job is scraping via the URL: http://localhost:9090/metrics.
- The time series data returned will detail the state and performance of the Prometheus server.
Starting Prometheus
To start Prometheus with our newly created configuration file, change to the directory containing the Prometheus binary and run:
1 | ./prometheus --config.file=prometheus.yml |
- Prometheus should start up. You should also be able to browse to a status page about itself at http://localhost:9090.
- Give it about 30 seconds to collect data about itself from its own HTTP metrics endpoint.
- You can also verify that Prometheus is serving metrics about itself
- by navigating to its own metrics endpoint: http://localhost:9090/metrics.
Using the expression browser
- Let us try looking at some data that Prometheus has collected about itself.
- To use Prometheus’s built-in expression browser
- navigate to http://localhost:9090/graph and choose the “Table“ view within the “Graph“ tab.
- As you can gather from http://localhost:9090/metrics,
- one metric that Prometheus exports about itself is called
promhttp_metric_handler_requests_total - the total number of /metrics requests the Prometheus server has served.
- one metric that Prometheus exports about itself is called
- Go ahead and enter this into the expression console:
1 | promhttp_metric_handler_requests_total |
This should return a number of different time series (along with the latest value recorded for each), all with the metric name promhttp_metric_handler_requests_total, but with different labels. These labels designate different requests statuses.
If we were only interested in requests that resulted in HTTP code 200, we could use this query to retrieve that information:
1 | promhttp_metric_handler_requests_total{code="200"} |
To count the number of returned time series, you could write:
1 | count(promhttp_metric_handler_requests_total) |
Using the graphing interface
To graph expressions, navigate to http://localhost:9090/graph and use the “Graph“ tab.
For example, enter the following expression to graph the per-second HTTP request rate returning status code 200 happening in the self-scraped Prometheus:
1 | rate(promhttp_metric_handler_requests_total{code="200"}[1m]) |
1 | 这个 PromQL 查询语句计算的是 promhttp_metric_handler_requests_total |
Monitoring other targets
- Collecting metrics from Prometheus alone isn’t a great representation of Prometheus’ capabilities.
- To get a better sense of what Prometheus can do, we recommend exploring documentation about other exporters.
Frequently asked questions
General
What is Prometheus?
- Prometheus is an open-source systems monitoring and alerting toolkit with an active ecosystem.
- It is the only system directly supported by Kubernetes and the de facto standard across the cloud native ecosystem.
What dependencies does Prometheus have?
The main Prometheus server runs standalone as a single monolithic binary and has no external dependencies.
Is this cloud native? - Yes.
- Cloud native is a flexible operating model, breaking up old service boundaries to allow for more flexible and scalable deployments.
- Prometheus’s service discovery integrates with most tools and clouds.
- Its dimensional data model and scale into the tens of millions(数千万) of active series allows it to monitor large cloud-native deployments.
- There are always trade-offs to make when running services, and Prometheus values reliably getting alerts out to humans above all else.
Can Prometheus be made highly available?
- Yes, run identical Prometheus servers on two or more separate machines.
- Identical alerts will be deduplicated by the Alertmanager
- Alertmanager supports high availability by interconnecting multiple Alertmanager instances to build an Alertmanager cluster.
- Instances of a cluster communicate using a gossip protocol managed via HashiCorp’s Memberlist library.
I was told Prometheus “doesn’t scale”.
- This is often more of a marketing claim than anything else.
- A single instance of Prometheus can be more performant than some systems positioning themselves as long term storage solution for Prometheus.
- You can run Prometheus reliably with tens of millions of active series.
What language is Prometheus written in?
Most Prometheus components are written in Go. Some are also written in Java, Python, and Ruby.
How stable are Prometheus features, storage formats, and APIs?
- All repositories in the Prometheus GitHub organization that have reached version 1.0.0 broadly follow semantic versioning.
- Breaking changes are indicated by increments of the major version.
- Exceptions are possible for experimental components, which are clearly marked as such in announcements.
- Even repositories that have not yet reached version 1.0.0 are, in general, quite stable.
- We aim for a proper release process and an eventual 1.0.0 release for each repository.
- In any case, breaking changes will be pointed out in release notes (marked by [CHANGE]) or communicated clearly for components that do not have formal releases yet.
Why do you pull rather than push?
- Pulling over HTTP offers a number of advantages:
- You can start extra monitoring instances as needed, e.g. on your laptop when developing changes.
- You can more easily and reliably tell if a target is down.
- You can manually go to a target and inspect its health with a web browser.
- Overall, we believe that pulling is slightly better than pushing, but it should not be considered a major point when considering a monitoring system.
- For cases where you must push, we offer the Pushgateway.
How to feed logs into Prometheus?
- Short answer: Don’t! Use something like Grafana Loki or OpenSearch instead.
- Longer answer: Prometheus is a system to collect and process metrics, not an event logging system.
- If you want to extract Prometheus metrics from application logs, Grafana Loki is designed for just that.
Who wrote Prometheus?
- Prometheus was initially started privately by Matt T. Proud and Julius Volz. The majority of its initial development was sponsored by SoundCloud
- It’s now maintained and extended by a wide range of companies and individuals.
What license is Prometheus released under?
Prometheus is released under the Apache 2.0 license.
What is the plural of Prometheus?
- After extensive research, it has been determined that the correct plural of ‘Prometheus’ is ‘Prometheis‘.
- If you can not remember this, “Prometheus instances“ is a good workaround.
Can I reload Prometheus’s configuration?
- Yes, sending SIGHUP to the Prometheus process or an HTTP POST request to the
/-/reloadendpoint will reload and apply the configuration file. - The various components attempt to handle failing changes gracefully.
Can I send alerts?
- Yes, with the Alertmanager
- We support sending alerts through email, various native integrations, and a webhook system anyone can add integrations to.
Can I create dashboards?
Yes, we recommend Grafana for production usage. There are also Console templates.
Can I change the timezone? Why is everything in UTC?
- To avoid any kind of timezone confusion, especially when the so-called daylight saving time is involved
- we decided to exclusively use Unix time internally and UTC for display purposes in all components of Prometheus.
- A carefully done timezone selection could be introduced into the UI. - Grafana
Instrumentation
Which languages have instrumentation libraries?
- There are a number of client libraries for instrumenting your services with Prometheus metrics.
- If you are interested in contributing a client library for a new language, see the exposition formats.
Can I monitor machines?
Yes, the Node Exporter exposes an extensive set of machine-level metrics on Linux and other Unix systems such as CPU usage, memory, disk utilization, filesystem fullness, and network bandwidth.
Can I monitor network devices?
Yes, the SNMP Exporter allows monitoring of devices that support SNMP. For industrial networks, there’s also a Modbus exporter.
Can I monitor batch jobs?
Yes, using the Pushgateway. See also the best practices for monitoring batch jobs.
Can I monitor JVM applications via JMX?
Yes, for applications that you cannot instrument directly with the Java client, you can use the JMX Exporter either standalone or as a Java Agent.
What is the performance impact of instrumentation?
- Performance across client libraries and languages may vary.
- For Java, benchmarks indicate that incrementing a counter/gauge with the Java client will take 12-17ns, depending on contention.
- This is negligible for all but the most latency-critical code.
Implementation
Why are all sample values 64-bit floats?
- We restrained ourselves to 64-bit floats to simplify the design.
- The IEEE 754 double-precision binary floating-point format supports integer precision for values up to 2^53.
- Supporting native 64 bit integers would (only) help if you need integer precision above 2^53 but below 2^63.
- In principle, support for different sample value types (including some kind of big integer, supporting even more than 64 bit) could be implemented, but it is not a priority right now.
- A counter, even if incremented one million times per second(一百万次每秒), will only run into precision issues after over 285 years.
Glossary
Alert
An alert is the outcome of an alerting rule in Prometheus that is actively firing. Alerts are sent from Prometheus to the Alertmanager.
Alertmanager
The Alertmanager takes in alerts, aggregates them into groups, de-duplicates, applies silences, throttles, and then sends out notifications to email, Pagerduty, Slack etc.
Bridge
- A bridge is a component that takes samples from a client library and exposes them to a non-Prometheus monitoring system.
- For example, the Python, Go, and Java clients can export metrics to Graphite.
- Prometheus -> Graphite
Client library
- A client library is a library in some language (e.g. Go, Java, Python, Ruby) that makes it easy to directly instrument your code
- write custom collectors to pull metrics from other systems and expose the metrics to Prometheus.
Collector
- A collector is a part of an exporter that represents a set of metrics.
- It may be a single metric if it is part of direct instrumentation, or many metrics if it is pulling metrics from another system.
1 | 根据文档中的定义和 Prometheus 的工作原理,Collector 是 Prometheus 监控体系中的一个核心概念。让我来详细解释: |
Direct instrumentation
Direct instrumentation is instrumentation added inline as part of the source code of a program, using a client library.
Endpoint
A source of metrics that can be scraped, usually corresponding to a single process.
Exporter
- An exporter is a binary running alongside the application you want to obtain metrics from.
- The exporter exposes Prometheus metrics
- commonly by converting metrics that are exposed in a non-Prometheus format into a format that Prometheus supports.
Instance
An instance is a label that uniquely identifies a target in a job.
Job
A collection of targets with the same purpose, for example monitoring a group of like processes replicated for scalability or reliability, is called a job.
Notification
A notification represents a group of one or more alerts, and is sent by the Alertmanager to email, Pagerduty, Slack etc.
Promdash
Promdash was a native dashboard builder for Prometheus. It has been deprecated and replaced by Grafana.
Prometheus
Prometheus usually refers to the core binary of the Prometheus system. It may also refer to the Prometheus monitoring system as a whole.
PromQL
- PromQL is the Prometheus Query Language.
- It allows for a wide range of operations including aggregation, slicing and dicing, prediction and joins.
Pushgateway
- The Pushgateway persists the most recent push of metrics from batch jobs.
- This allows Prometheus to scrape their metrics after they have terminated.
Recording Rules
Recording rules precompute frequently needed or computationally expensive expressions and save their results as a new set of time series.
Remote Read
Remote read is a Prometheus feature that allows transparent reading of time series from other systems (such as long term storage) as part of queries.
Remote Read Adapter
- Not all systems directly support remote read.
- A remote read adapter sits between Prometheus and another system, converting time series requests and responses between them.
Remote Read Endpoint
A remote read endpoint is what Prometheus talks to when doing a remote read.
Remote Write
Remote write is a Prometheus feature that allows sending ingested samples on the fly to other systems, such as long term storage.
Remote Write Adapter
- Not all systems directly support remote write.
- A remote write adapter sits between Prometheus and another system
- converting the samples in the remote write into a format the other system can understand.
Remote Write Endpoint
A remote write endpoint is what Prometheus talks to when doing a remote write.
Sample
a float64 value + a millisecond-precision timestamp
- A sample is a single value at a point in time in a time series.
- In Prometheus, each sample consists of a float64 value and a millisecond-precision timestamp.
Silence
A silence in the Alertmanager prevents alerts, with labels matching the silence, from being included in notifications.
Target
- A target is the definition of an object to scrape.
- For example, what labels to apply, any authentication required to connect, or other information that defines how the scrape will occur.
Time Series
same metric + same set of labeled dimensions
- The Prometheus time series are streams of timestamped values belonging to the same metric and the same set of labeled dimensions.
- Prometheus stores all data as time series.