Linux使用 -- sar + iftop
sar
1 | yum install sysstat |
CPU
1 | $ sar -u ALL 1 5 |
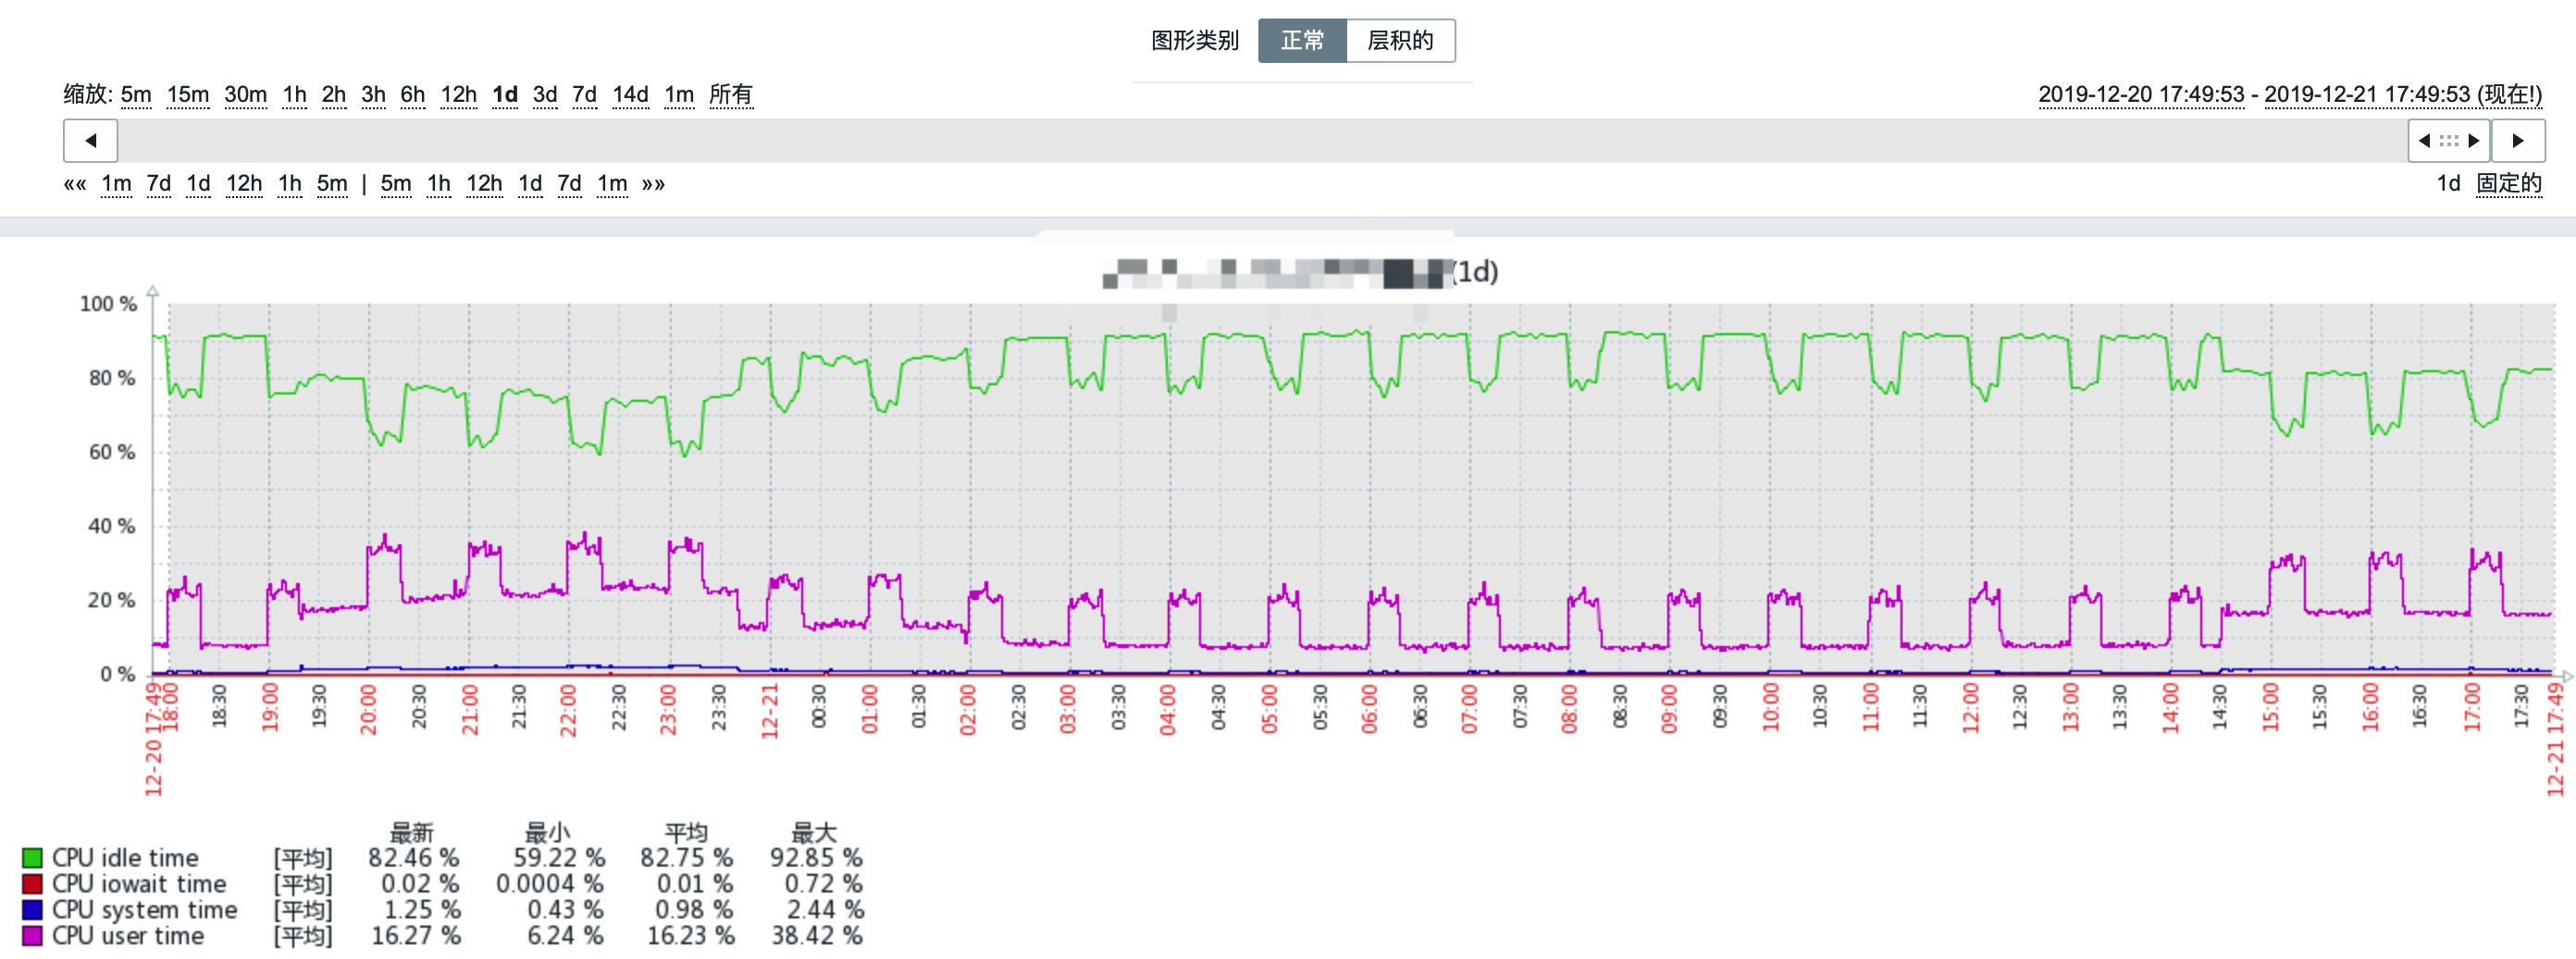
- %user
- Percentage of CPU utilization that occurred while executing at the user level (application).
- Note that this field includes time spent running virtual processors.
- %usr
- Percentage of CPU utilization that occurred while executing at the user level (application).
- Note that this field does NOT include time spent running virtual processors.
- %nice
- Percentage of CPU utilization that occurred while executing at the user level with nice priority.
- %system
- Percentage of CPU utilization that occurred while executing at the system level (kernel).
- Note that this field includes time spent servicing hardware and software interrupts.
- %sys
- Percentage of CPU utilization that occurred while executing at the system level (kernel).
- Note that this field does NOT include time spent servicing hardware or software interrupts.
- %iowait
- Percentage of time that the CPU or CPUs were idle during which the system had an outstanding disk I/O request.
- %steal
- Percentage of time spent in involuntary wait by the virtual CPU or CPUs while the hypervisor was servicing another virtual processor.
- %irq
- Percentage of time spent by the CPU or CPUs to service hardware interrupts.
- %soft
- Percentage of time spent by the CPU or CPUs to service software interrupts.
- %guest
- Percentage of time spent by the CPU or CPUs to run a virtual processor.
- %gnice
- Percentage of time spent by the CPU or CPUs to run a niced guest.
- %idle
- Percentage of time that the CPU or CPUs were idle and the system did not have an outstanding disk I/O request.

内存
1 | $ sar -r 1 5 |
- kbmemfree
- Amount of free memory available in kilobytes.
- kbmemused
- Amount of used memory in kilobytes (calculated as total installed memory - kbmemfree - kbbuffers - kbcached - kbslab).
- %memused
- Percentage of used memory.
- kbbuffers
- Amount of memory used as buffers by the kernel in kilobytes.
- kbcached
- Amount of memory used to cache data by the kernel in kilobytes.
- kbcommit
- Amount of memory in kilobytes needed for current workload.
- This is an estimate of how much RAM/swap is needed to guarantee that there never is out of memory.
- %commit
- Percentage of memory needed for current workload in relation to the total amount of memory (RAM+swap).
- This number may be greater than 100% because the kernel usually overcommits memory.
- kbslab
- Amount of memory in kilobytes used by the kernel to cache data structures for its own use.
IO
1 | $ sar -b 1 5 |
- tps
- Total number of transfers per second that were issued to physical devices. A transfer is an I/O request to a physical device. Multiple logical requests can be combined into a single I/O request to the device. A transfer is of indeterminate size.
- rtps
- Total number of read requests per second issued to physical devices.
- wtps
- Total number of write requests per second issued to physical devices.
- bread/s
- Total amount of data read from the devices in blocks per second. Blocks are equivalent to sectors and therefore have a size of 512 bytes.
- bwrtn/s
- Total amount of data written to devices in blocks per second.
设备
1 | $ df -h |
- tps
- Indicate the number of transfers per second that were issued to the device. Multiple logical requests can be combined into a single I/O request to the device. A transfer is of indeterminate size.
- rd_sec/s
- Number of sectors read from the device. The size of a sector is 512 bytes.
- wr_sec/s
- Number of sectors written to the device. The size of a sector is 512 bytes.
- avgrq-sz
- The average size (in sectors) of the requests that were issued to the device.
- avgqu-sz
- The average queue length of the requests that were issued to the device.
- await
- The average time (in milliseconds) for I/O requests issued to the device to be served. This includes the time spent by the requests in queue and the time spent servicing them.
- svctm
- The average service time (in milliseconds) for I/O requests that were issued to the device.
- Warning! Do not trust this field any more. This field will be removed in a future sysstat version.
- %util
- Percentage of elapsed time during which I/O requests were issued to the device (bandwidth utilization for the device).
- Device saturation occurs when this value is close to 100%.
进程
1 | $ sar -q 1 5 |
- runq-sz
- Run queue length (number of tasks waiting for runtime).
- plist-sz
- Number of tasks in the task list.
- ldavg-1
- System load average for the last minute.
- The load average is calculated as the average number of runnable or running tasks (R state), and the number of tasks in uninterruptible sleep (D state) over the specified interval.
- ldavg-5
- System load average for the past 5 minutes.
- ldavg-15
- System load average for the past 15 minutes.
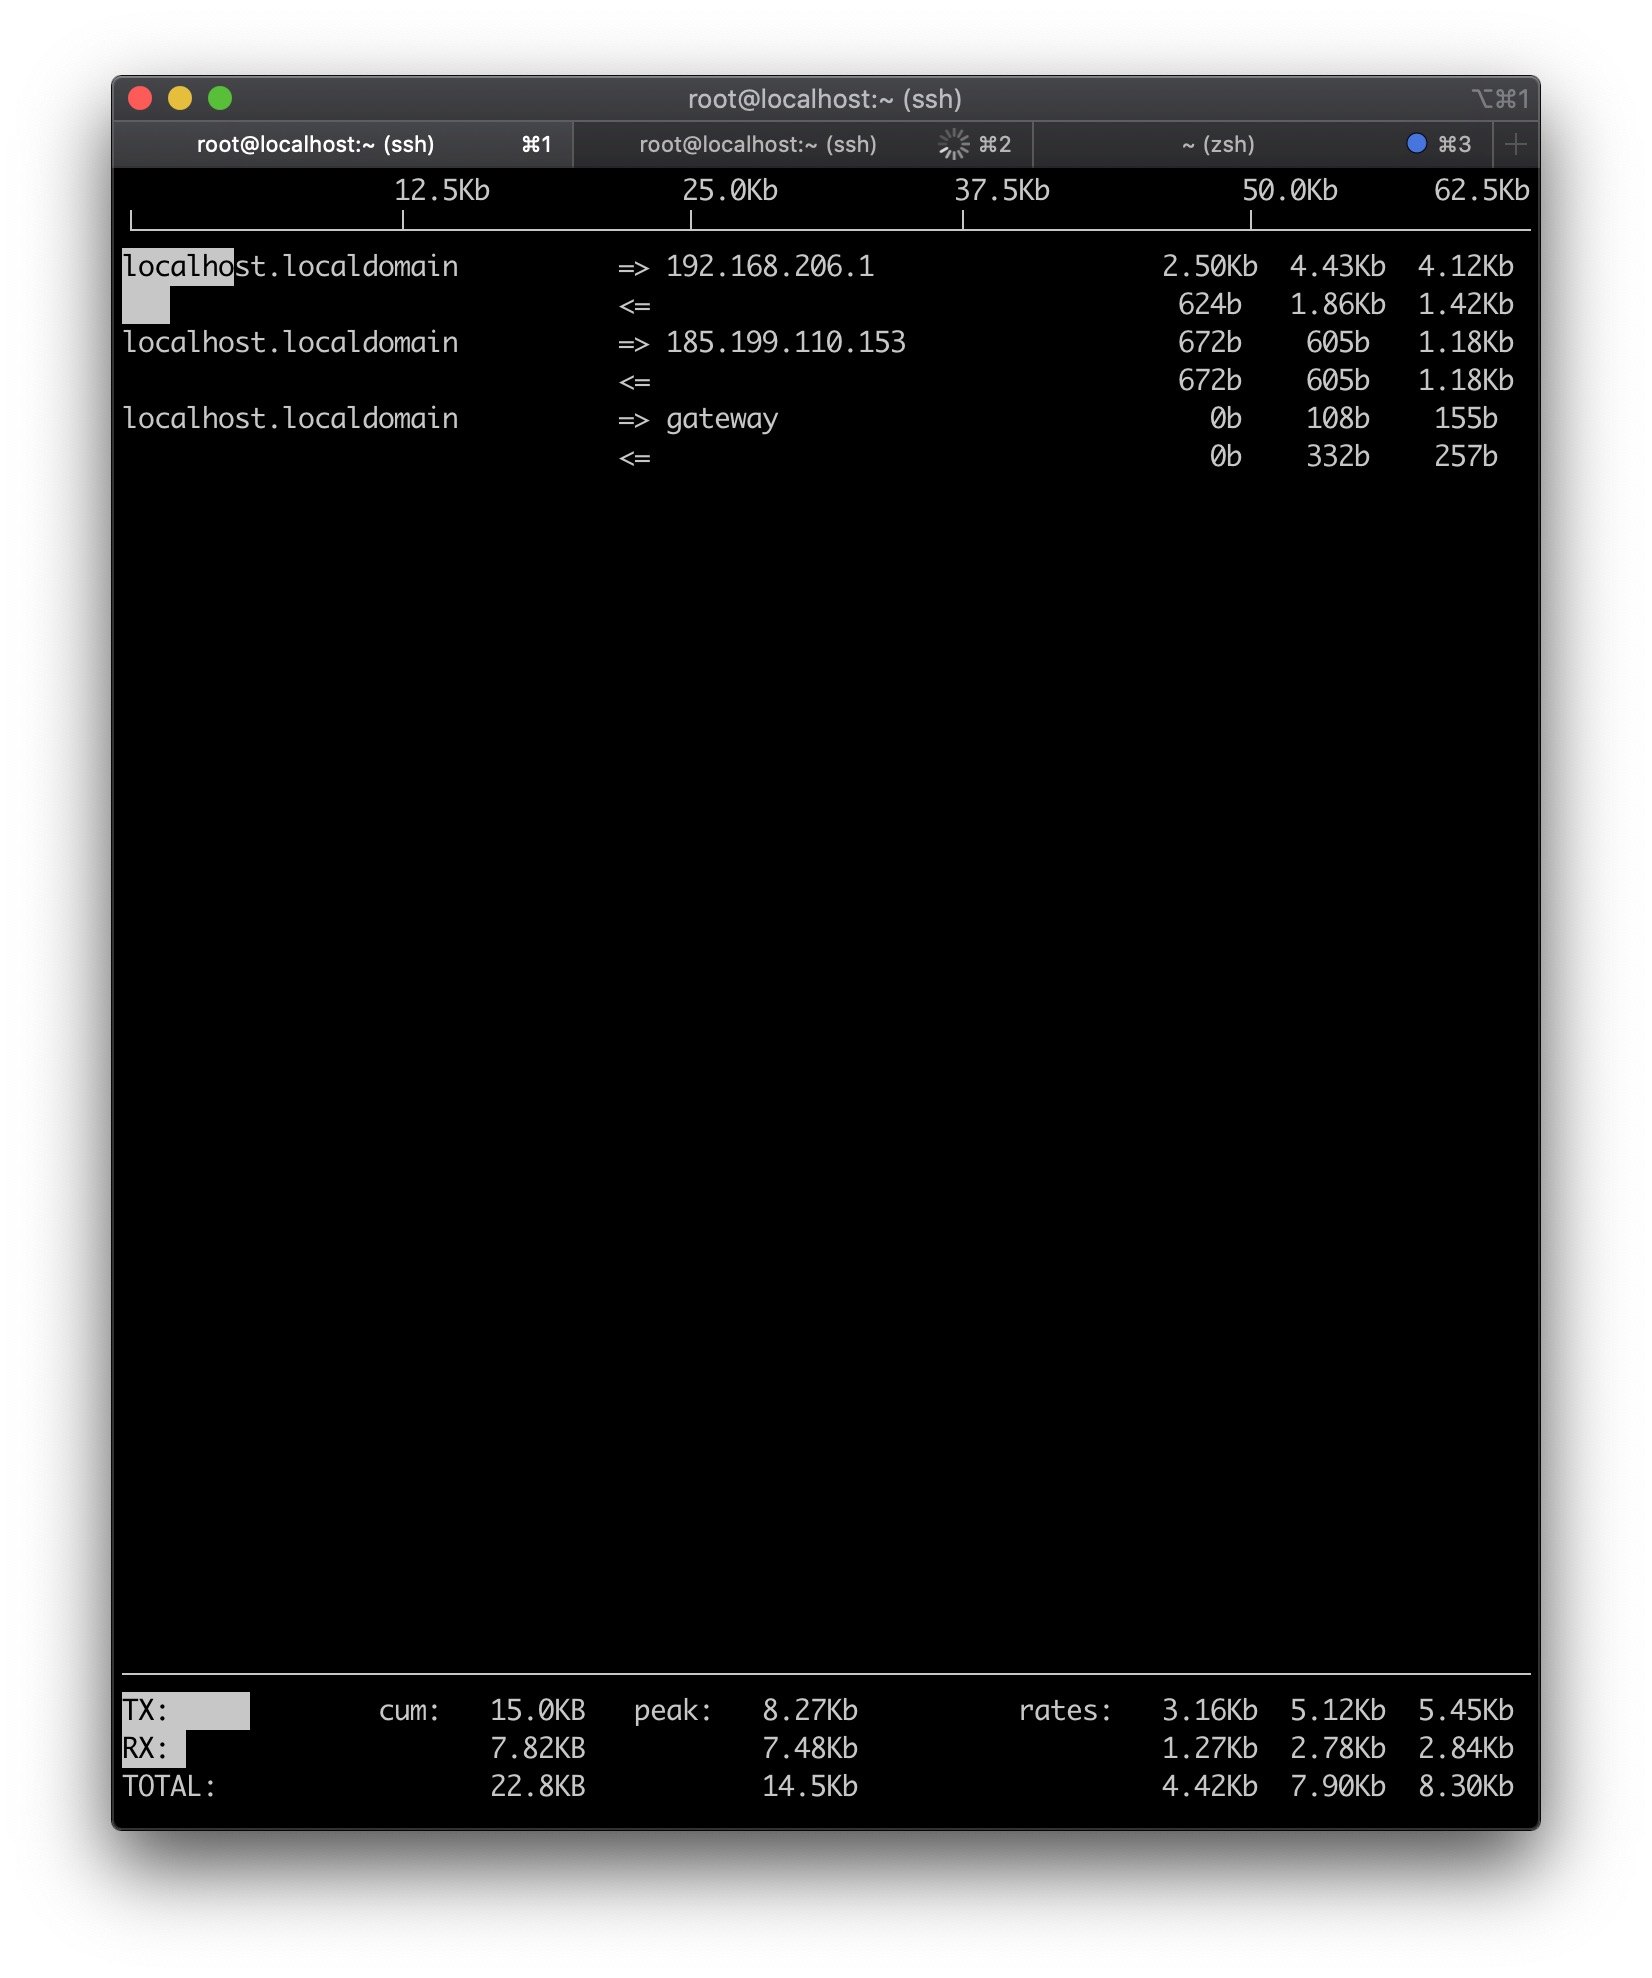
iftop
1 | yum install epel-release |

参考资料
All articles on this blog are licensed under CC BY-NC-SA 4.0 unless otherwise stated.


