Observability - OpenTelemetry Doc V1
架构
OpenTelemetry 也被称为 OTel,是一个供应商中立的、开源的可观测性框架, 可用于插桩、生成、采集和导出链路、 指标和日志等遥测数据

概述
专注于数据标准,不提供存储和可视化
- OpenTelemetry 是一个可观测性框架和工具包, 旨在创建和管理遥测数据,如链路、 指标和日志
- OpenTelemetry 是供应商和工具无关的,这意味着它可以与各种可观测性后端一起使用, 包括 Jaeger 和 Prometheus 这类开源工具以及商业化产品
- OpenTelemetry 不是像 Jaeger、Prometheus 或其他商业供应商那样的可观测性后端
- OpenTelemetry 专注于遥测数据的生成、采集、管理和导出
- OpenTelemetry 的一个主要目标是, 无论应用程序或系统采用何种编程语言、基础设施或运行时环境,你都可以轻松地将其仪表化
- 遥测数据的存储和可视化是有意留给其他工具处理
可观测性
- 可观测性是通过检查系统输出来理解系统内部状态的能力
- 在软件的背景下,这意味着能够通过检查遥测数据(包括链路、指标和日志)来理解系统的内部状态
- 要使系统可观测,必须对其进行仪表化
- 代码必须发出链路、指标或日志,然后,仪表化的数据必须发送到可观测性后端
OpenTelemetry
OpenTelemetry 满足可观测性的需求,并遵循两个关键原则
- 你所生成的数据归属于你自己,不会被供应商锁定
- 你只需要学习一套 API 和约定
主要组件
- 适用于所有组件的规范
- 定义遥测数据形状的标准协议
- 为常见遥测数据类型定义标准命名方案的语义约定
- 定义如何生成遥测数据的 API
- 实现规范、API 和遥测数据导出的语言 SDK
- 实现常见库和框架的仪表化的库生态系统
- 可自动生成遥测数据的自动仪表化组件,无需更改代码
- OpenTelemetry Collector:接收、处理和导出遥测数据的代理
- 各种其他工具
- OpenTelemetry Operator for Kubernetes
- OpenTelemetry Helm Charts
- FaaS
可扩展性
OpenTelemetry 被设计为可扩展的 - 几乎每个层面都可以实现扩展
- 向 OpenTelemetry Collector 添加接收器以支持来自自定义源的遥测数据
- 将自定义仪表化库加载到 SDK 中
- 创建适用于特定用例的 SDK 或 Collector 的分发
- A distribution, not to be confused with a fork, is customized version of an OpenTelemetry component.
- 为尚不支持 OpenTelemetry 协议(OTLP)的自定义后端创建新的导出器
- 为非标准上下文传播格式创建自定义传播器
概念
入门
Observability
- 可观测性让你能够从外部理解一个系统,它允许你在不了解系统内部运作的情况下,对该系统提出问题
- 可观测性能帮你轻松排查和处理新出现的问题,也就是所谓的”未知的未知“
- 要对你的系统提出这些问题,你的应用程序必须进行适当的插桩
- 应用程序代码必须能够发出信号, 例如链路、 指标和日志
- 当开发人员不需要添加更多插桩就能排查问题时, 我们就可以说这个应用程序已经完成了适当的插桩,因为他们已经拥有了所需的所有信息
- OpenTelemetry 就是一种为应用程序代码进行插桩的机制,它的目的是帮助使系统变得可观测
可靠性 + 指标
Telemetry
- Telemetry 指的是系统及其行为发出的数据。这些数据可以是链路、指标和日志的形式
可靠性
- 服务是否在按用户期望的方式运行?
指标
- 指标是对一段时间内基础设施或应用程序的数值数据的汇总
- 例如:系统错误率、CPU 使用率和特定服务的请求率
SLI - Service Level Indicator - 技术指标
- 即服务水平指标(Service Level Indicator),代表对服务行为的衡量
- 一个好的 SLI 应该从用户的角度来衡量你的服务 - 网页加载的速度
SLO - Service Level Objective - 业务价值
- 服务水平目标(Service Level Objective)是一种向组织内部或其他团队传达服务可靠性的方法
- SLO 通过将具体的技术指标(SLI)与业务目标关联起来,使技术性能变得对业务有意义
- 网站页面加载时间(SLI)必须在3秒内,以确保良好的用户体验和提高转化率(业务价值)
分布式链路
- 分布式链路让你能够观察请求如何在复杂的分布式系统中传播
- 提高了应用程序或系统健康状况的可见性,并让你能够调试那些难以在本地重现的行为
- 对于分布式系统来说,分布式链路是必不可少的,因为这些系统通常存在不确定性问题,或者过于复杂而无法在本地重现
日志
- 日志是由服务或其他组件发出的带时间戳的消息
- 与链路不同,它们不一定与特定的用户请求或事务相关联
- 日志虽然有用,但仅靠它们来追踪代码执行还不够,因为日志通常缺乏上下文信息,比如它们是从哪里被调用的
- 当日志作为 span(跨度)的一部分,或者与 trace(链路)和 span 关联起来时,它们的价值就会大大增加
Spans
- Span(跨度)是分布式链路中的基本构建块,它代表了一个具体的操作或工作单元
- 每个 span 都记录了请求中的特定动作,帮助我们了解操作执行过程中发生的详细情况
- 一个 span 包含名称、时间相关的数据、结构化的日志消息,以及其他元数据(属性),这些信息共同描绘了该操作的完整画面
- 属性 - 附加在 span 上的额外信息 - 提供了更多关于操作上下文的细节
分布式链路
- 记录了请求(无论是来自应用程序还是终端用户)在多服务架构(如微服务和无服务器应用)中传播的路径
- 一个 Trace 由一个或多个 Span 组成
- 第一个 Span 被称为根 Span,它代表了一个请求从开始到结束的全过程
- 根 Span 下的子 Span 则提供了请求过程中更详细的上下文信息(或者说,构成了请求的各个步骤)
- 如果没有链路,在分布式系统中找出性能问题的根源将会非常具有挑战性
- 链路通过分解请求在分布式系统中的流转过程,使得调试和理解分布式系统变得不那么令人生畏
许多可观测性后端会将链路可视化为瀑布图 - 清晰地展示了根 span 与其子 span 之间的父子关系 - 表现为嵌套结构

上下文传播
- 通过上下文传播,信号可以相互关联, 无论它们是在何处生成的
- 尽管它不仅限于链路追踪,但它允许 trace 跨进程和网络边界任意分布的服务构建相关系统的关联信息
上下文
上下文是一个对象,它包含发送和接收服务 (或执行单元) 用于将一个信号与另一个信号关联起来的信息
如果服务 A 调用服务 B
那么服务 A 中 ID 在上下文中的 span 将用作服务 B 中创建的下一个 span 的父 span
上下文中的 trace ID 也将用于服务 B 中创建的下一个 span, 这表示该 span 与服务 A 中的 span 属于同一 trace 的一部分
传播
- 传播是上下文在服务和进程之间移动的机制
- 它序列化或反序列化上下文对象并提供要从一个服务传播到另一个服务的相关信息
- 传播通常由检测库处理并且对用户是透明的,但如果你需要手动传播上下文,则可以使用传播 API
- OpenTelemetry 维护着几个官方传播器,默认传播器使用 W3C Trace Context规范指定的标头
信号
- OpenTelemetry 的目的是收集、处理和导出信号
- 信号是系统输出,描述了操作系统和平台上运行的应用程序的底层活动
- 信号可以是你希望在特定时间点测量的某项指标,如温度或内存使用率, 也可以是贯穿分布式系统组件的事件,你希望对其进行跟踪
- 可以将不同的信号组合在一起,从不同角度观察同一种技术的内部运作方式
- 目前,OpenTelemetry 支持以下类型的信号 - Traces + Metrics + Logs + Baggage
- 事件是一种特定类型的日志,而 profiles 正在由 Profiling 工作组开发
Traces
The path of a request through your application.
- Traces give us the big picture of what happens when a request is made to an application.
- Whether your application is a monolith with a single database or a sophisticated mesh of services
- traces are essential to understanding the full “path” a request takes in your application.
hello span
1 | { |
- This is the root span, denoting the beginning and end of the entire operation.
- Note that it has a trace_id field indicating the trace, but has no parent_id. That’s how you know it’s the root span.
hello-greetings span
1 | { |
- This span encapsulates specific tasks, like saying greetings, and its parent is the hello span.
- Note that it shares the same trace_id as the root span, indicating it’s a part of the same trace.
- Additionally, it has a parent_id that matches the span_id of the hello span.
hello-salutations span
1 | { |
- This span represents the third operation in this trace and, like the previous one, it’s a child of the hello span.
- That also makes it a sibling of the hello-greetings span.
Summary
- These three blocks of JSON all share the same trace_id, and the parent_id field represents a hierarchy. That makes it a Trace!
- Another thing you’ll note is that each Span looks like a structured log. That’s because it kind of is!
- One way to think of Traces is that they’re a collection of structured logs with context, correlation, hierarchy, and more baked in.
- However, these “structured logs” can come from different processes, services, VMs, data centers, and so on.
- This is what allows tracing to represent an end-to-end view of any system.
To understand how tracing in OpenTelemetry works, let’s look at a list of components that will play a part in instrumenting our code.
Tracer Provider
- A Tracer Provider (sometimes called TracerProvider) is a factory for Tracers.
- In most applications, a Tracer Provider is initialized once and its lifecycle matches the application’s lifecycle.
- Tracer Provider initialization also includes Resource and Exporter initialization.
- It is typically the first step in tracing with OpenTelemetry.
- In some language SDKs, a global Tracer Provider is already initialized for you.
Tracer
- A Tracer creates spans containing more information about what is happening for a given operation, such as a request in a service.
- Tracers are created from Tracer Providers.
Trace Exporters
- Trace Exporters send traces to a consumer.
- This consumer can be standard output, the OpenTelemetry Collector, or any open source or vendor backend of your choice.
Context Propagation
- Context Propagation is the core concept that enables Distributed Tracing.
- With Context Propagation, Spans can be correlated with each other and assembled into a trace, regardless of where Spans are generated.
Spans
- A span represents a unit of work or operation.
- Spans are the building blocks of Traces.
- In OpenTelemetry, they include the following information
- Name
- Parent span ID (empty for root spans)
- Start and End Timestamps
- Span Context
- Attributes
- Span Events
- Span Links
- Span Status
Sample span
1 | { |
- Spans can be nested, as is implied by the presence of a parent span ID: child spans represent sub-operations.
- This allows spans to more accurately capture the work done in an application.
Span Context
- Span context is an immutable object on every span that contains the following
- The Trace ID representing the trace that the span is a part of
- The span’s Span ID
- Trace Flags, a binary encoding containing information about the trace
- Trace State, a list of key-value pairs that can carry vendor-specific trace information
- Span context is the part of a span that is serialized and propagated alongside Distributed Context and Baggage.
- Because Span Context contains the Trace ID, it is used when creating Span Links.
Attributes
- Attributes are key-value pairs that contain metadata that you can use to annotate a Span to carry information about the operation it is tracking.
- For example, if a span tracks an operation that adds an item to a user’s shopping cart in an eCommerce system
- you can capture the user’s ID, the ID of the item to add to the cart, and the cart ID.
- You can add attributes to spans during or after span creation.
- Prefer adding attributes at span creation to make the attributes available to SDK sampling.
- If you have to add a value after span creation, update the span with the value.
- Attributes have the following rules that each language SDK implements
- Keys must be non-null string values
- Values must be a non-null string, boolean, floating point value, integer, or an array of these values
- Additionally, there are Semantic Attributes, which are known naming conventions for metadata that is typically present in common operations.
- It’s helpful to use semantic attribute naming wherever possible so that common kinds of metadata are standardized across systems.
Span Events
- A Span Event can be thought of as a structured log message (or annotation) on a Span
- typically used to denote a meaningful, singular point in time during the Span’s duration.
- For example, consider two scenarios in a web browser
- Tracking a page load - Span
- Denoting when a page becomes interactive - Span Event
- A Span is best used to the first scenario because it’s an operation with a start and an end.
- A Span Event is best used to track the second scenario because it represents a meaningful, singular point in time.
When to use span events versus span attributes
- Since span events also contain attributes, the question of when to use events instead of attributes might not always have an obvious answer.
- To inform your decision, consider whether a specific timestamp is meaningful.
- When you’re tracking an operation with a span and the operation completes, you might want to add data from the operation to your telemetry.
- If the timestamp in which the operation completes is meaningful or relevant, attach the data to a span event.
- If the timestamp isn’t meaningful, attach the data as span attributes.
Span Links
Causal relationship
- Links exist so that you can associate one span with one or more spans, implying a causal relationship.
- For example, let’s say we have a distributed system where some operations are tracked by a trace.
- In response to some of these operations, an additional operation is queued to be executed, but its execution is asynchronous.
- We can track this subsequent operation with a trace as well.
- We would like to associate the trace for the subsequent operations with the first trace
- but we cannot predict when the subsequent operations will start.
- We need to associate these two traces, so we will use a span link.
- You can link the last span from the first trace to the first span in the second trace.
- Now, they are causally associated with one another.
- Links are optional but serve as a good way to associate trace spans with one another.
Span Status
- Each span has a status. The three possible values are - Unset + Error + Ok
- The default value is Unset
- A span status that is Unset means that the operation it tracked successfully completed without an error.
- When a span status is Error, then that means some error occurred in the operation it tracks.
- For example, this could be due to an HTTP 500 error on a server handling a request.
- When a span status is Ok, then that means the span was explicitly marked as error-free by the developer of an application.
- it’s not required to set a span status as Ok when a span is known to have completed without error, as this is covered by Unset.
- What Ok does is represent an unambiguous “final call” on the status of a span that has been explicitly set by a user.
- This is helpful in any situation where a developer wishes for there to be no other interpretation of a span other than “successful”.
- To reiterate
- Unset represents a span that completed without an error.
- Ok represents when a developer explicitly marks a span as successful.
- In most cases, it is not necessary to explicitly mark a span as Ok.
Span Kind
- When a span is created, it is one of Client, Server, Internal, Producer, or Consumer.
- This span kind provides a hint to the tracing backend as to how the trace should be assembled.
- The parent of a server span is often a remote client span, and the child of a client span is usually a server span.
- Similarly, the parent of a consumer span is always a producer and the child of a producer span is always a consumer.
- If not provided, the span kind is assumed to be internal.
Client
- A client span represents a synchronous outgoing remote call such as an outgoing HTTP request or database call.
- Note that in this context, “synchronous” does not refer to async/await, but to the fact that it is not queued for later processing.
Server
- A server span represents a synchronous incoming remote call such as an incoming HTTP request or remote procedure call.
Internal
- Internal spans represent operations which do not cross a process boundary.
- Things like instrumenting a function call or an Express middleware may use internal spans.
Producer
- Producer spans represent the creation of a job which may be asynchronously processed later.
- It may be a remote job such as one inserted into a job queue or a local job handled by an event listener.
Consumer
- Consumer spans represent the processing of a job created by a producer and may start long after the producer span has already ended.
Metrics
A measurement captured at runtime.
- A metric is a measurement of a service captured at runtime.
- The moment of capturing a measurements is known as a metric event
- which consists not only of the measurement itself, but also the time at which it was captured and associated metadata.
- Application and request metrics are important indicators of availability and performance.
- Custom metrics can provide insights into how availability indicators impact user experience or the business.
- Collected data can be used to alert of an outage or trigger scheduling decisions to scale up a deployment automatically upon high demand.
To understand how metrics in OpenTelemetry works, let’s look at a list of components that will play a part in instrumenting our code.
Meter Provider
- A Meter Provider (sometimes called MeterProvider) is a factory for Meters.
- In most applications, a Meter Provider is initialized once and its lifecycle matches the application’s lifecycle.
- Meter Provider initialization also includes Resource and Exporter initialization.
- It is typically the first step in metering with OpenTelemetry.
- In some language SDKs, a global Meter Provider is already initialized for you.
Meter
- A Meter creates metric instruments, capturing measurements about a service at runtime.
- Meters are created from Meter Providers.
Metric Exporter
- Metric Exporters send metric data to a consumer.
- This consumer can be standard output, the OpenTelemetry Collector, or any open source or vendor backend of your choice.
Metric Instruments
- In OpenTelemetry measurements are captured by metric instruments.
- A metric instrument is defined by - Name + Kind + Unit (optional) + Description (optional)
- The name, unit, and description
- are chosen by the developer or defined via semantic conventions for common ones like request and process metrics.
The instrument kind is one of the following:
- Counter
- A value that accumulates over time
- you can think of this like an odometer on a car; it only ever goes up.
- Asynchronous Counter
- Same as the Counter, but is collected once for each export.
- Could be used if you don’t have access to the continuous increments, but only to the aggregated value.
- UpDownCounter
- A value that accumulates over time, but can also go down again.
- An example could be a queue length, it will increase and decrease with the number of work items in the queue.
- Asynchronous UpDownCounter
- Same as the UpDownCounter, but is collected once for each export.
- Could be used if you don’t have access to the continuous changes, but only to the aggregated value (e.g., current queue size).
- Gauge
- Measures a current value at the time it is read.
- An example would be the fuel gauge in a vehicle. Gauges are synchronous.
- Asynchronous Gauge
- Same as the Gauge, but is collected once for each export.
- Could be used if you don’t have access to the continuous changes, but only to the aggregated value.
- Histogram
- A client-side aggregation of values, such as request latencies.
- A histogram is a good choice if you are interested in value statistics.
- For example: How many requests take fewer than 1s?
Aggregation
- An aggregation is a technique whereby a large number of measurements are combined into either exact or estimated statistics about metric events that took place during a time window.
- The OTLP protocol transports such aggregated metrics.
- The OpenTelemetry API provides a default aggregation for each instrument which can be overridden using the Views.
- The OpenTelemetry project aims to provide default aggregations that are supported by visualizers and telemetry backends.
- Unlike request tracing, which is intended to capture request lifecycles and provide context to the individual pieces of a request
- metrics are intended to provide statistical information in aggregate.
Views
- A view provides SDK users with the flexibility to customize the metrics output by the SDK.
- You can customize which metric instruments are to be processed or ignored.
- You can also customize aggregation and what attributes you want to report on metrics.
Language Support
Metrics are a stable signal in the OpenTelemetry specification.
| Language | Metrics |
|---|---|
| C++ | Stable |
| C#/.NET | Stable |
| Go | Stable |
| Java | Stable |
| JavaScript | Stable |
| PHP | Stable |
| Python | Stable |
Logs
A recording of an event.
- A log is a timestamped text record, either structured (recommended) or unstructured, with optional metadata.
- Of all telemetry signals, logs have the biggest legacy.
- Most programming languages have built-in logging capabilities or well-known, widely used logging libraries.
OpenTelemetry logs
- OpenTelemetry does not define a bespoke API or SDK to create logs.
- Instead, OpenTelemetry logs are the existing logs you already have from a logging framework or infrastructure component.
- OpenTelemetry SDKs and autoinstrumentation utilize several components to automatically correlate logs with traces.
- OpenTelemetry’s support for logs is designed to be fully compatible with what you already have
- providing capabilities to wrap those logs with additional context
- and a common toolkit to parse and manipulate logs into a common format across many different sources.
OpenTelemetry logs in the OpenTelemetry Collector
- Several receivers which parse logs from specific, known sources of log data.
- The filelogreceiver, which reads logs from any file and provides features to parse them from different formats or use a regular expression.
- Processors like the transformprocessor which lets you parse nested data, flatten nested structures, add/remove/update values, and more.
- Exporters that let you emit log data in a non-OpenTelemetry format.
- The first step in adopting OpenTelemetry frequently involves deploying a Collector as a general-purposes logging agent.
OpenTelemetry logs for applications
- In applications, OpenTelemetry logs are created with any logging library or built-in logging capabilities.
- When you add autoinstrumentation or activate an SDK
- OpenTelemetry will automatically correlate your existing logs with any active trace and span, wrapping the log body with their IDs.
- In other words, OpenTelemetry automatically correlates your logs and traces.
Language support - Logs are a stable signal in the OpenTelemetry specification.
| Language | Traces | Metrics | Logs |
|---|---|---|---|
| C++ | Stable | Stable | Stable |
| C#/.NET | Stable | Stable | Stable |
| Go | Stable | Stable | Beta |
| Java | Stable | Stable | Stable |
| JavaScript | Stable | Stable | Development |
| PHP | Stable | Stable | Stable |
| Python | Stable | Stable | Development |
Structured + Unstructured + Semistructured
- OpenTelemetry does not technically distinguish between structured and unstructured logs. You can use any log you have with OpenTelemetry.
- However, not all log formats are equally useful!
- Structured logs, in particular, are recommended for production observability because they are easy to parse and analyze at scale.
Structured logs
- A structured log is a log whose textual format follows a consistent, machine-readable format.
- For applications, one of the most common formats is JSON
- For infrastructure components, Common Log Format (CLF) is commonly used
- It is also common to have different structured log formats mixed together.
- For example, an Extended Log Format (ELF) log can mix JSON with the whitespace-separated data in a CLF log.
- Parse both the JSON and the ELF-related pieces into a shared format to make analysis on an observability backend easier.
- The filelogreceiver in the OpenTelemetry Collector contains standardized ways to parse logs like this.
- Structured logs are the preferred way to use logs.
- Because structured logs are emitted in a consistent format, they are straightforward to parse
- makes them easier to preprocess in an OpenTelemetry Collector, correlate with other data, and ultimate analyze in an Observability backend.
Unstructured logs
- Unstructured logs are logs that don’t follow a consistent structure.
- They may be more human-readable, and are often used in development.
- However, it is not preferred to use unstructured logs for production observability purposes
- since they are much more difficult to parse and analyze at scale.
- It is possible to store and analyze Unstructured logs in production
- although you may need to do substantial work to parse or otherwise pre-process them to be machine-readable.
- This will typically be necessary for a logging backend to know how to sort and organize the logs by timestamp.
- Although it’s possible to parse unstructured logs for analysis purposes, doing this may be more work than switching to structured logging
- such as via a standard logging framework in your applications.
Semistructured logs
- A semistructured log is a log that does use some self-consistent patterns to distinguish data so that it’s machine-readable
- but may not use the same formatting and delimiters between data across different systems.
- Although machine-readable, semistructured logs may require several different parsers to allow for analysis at scale.
OpenTelemetry logging components
Log Appender / Bridge
- As an application developer, the Logs Bridge API should not be called by you directly
- as it is provided for logging library authors to build log appenders / bridges.
- Instead, you just use your preferred logging library and configure it to use a log appender (or log bridge)
- that is able to emit logs into an OpenTelemetry LogRecordExporter.
- OpenTelemetry language SDKs offer this functionality.
Logger Provider
Part of the Logs Bridge API and should only be used if you are the author of a logging library.
- A Logger Provider (sometimes called LoggerProvider) is a factory for Loggers.
- In most cases, the Logger Provider is initialized once and its lifecycle matches the application’s lifecycle.
- Logger Provider initialization also includes Resource and Exporter initialization.
Logger
Part of the Logs Bridge API and should only be used if you are the author of a logging library.
- A Logger creates log records. Loggers are created from Log Providers.
Log Record Exporter
- Log Record Exporters send log records to a consumer.
- This consumer can be standard output, the OpenTelemetry Collector, or any open source or vendor backend of your choice.
Log Record
- A log record represents the recording of an event.
- In OpenTelemetry a log record contains two kinds of fields
- Named top-level fields of specific type and meaning
- Resource and attributes fields of arbitrary value and type
The top-level fields are
| Field Name | Description |
|---|---|
| Timestamp | Time when the event occurred. |
| ObservedTimestamp | Time when the event was observed. |
| TraceId | Request trace ID. |
| SpanId | Request span ID. |
| TraceFlags | W3C trace flag. |
| SeverityText | The severity text (also known as log level). |
| SeverityNumber | Numerical value of the severity. |
| Body | The body of the log record. |
| Resource | Describes the source of the log. |
| InstrumentationScope | Describes the scope that emitted the log. |
| Attributes | Additional information about the event. |
Baggage
Contextual information that is passed between signals.
- In OpenTelemetry, Baggage is contextual information that resides next to context.
- Baggage is a key-value store, which means it lets you propagate any data you like alongside context.
- Baggage means you can pass data across services and processes, making it available to add to traces, metrics, or logs in those services.
Example
- Baggage is often used in tracing to propagate additional data across services.
- For example, imagine you have a clientId at the start of a request, but you’d like for that ID to be available on all spans in a trace
- some metrics in another service, and some logs along the way.
- Because the trace may span multiple services
- you need some way to propagate that data without copying the clientId across many places in your codebase.
- By using Context Propagation to pass baggage across these services, the clientId is available to add to any additional spans, metrics, or logs.
- Additionally, instrumentations automatically propagate baggage for you.

What should OTel Baggage be used for?
- Baggage is best used to include information typically available only at the start of a request further downstream.
- This can include things like Account Identification, User IDs, Product IDs, and origin IPs, for example.
- Propagating this information using baggage allows for deeper analysis of telemetry in a backend.
- For example, if you include information like a User ID on a span that tracks a database call
- you can much more easily answer questions like “**which users are experiencing the slowest database calls?**”
- You can also log information about a downstream operation and include that same User ID in the log data.

Baggage security considerations
- Sensitive Baggage items can be shared with unintended resources, like third-party APIs.
- This is because automatic instrumentation includes Baggage in most of your service’s network requests.
- Specifically, Baggage and other parts of trace context are sent in HTTP headers, making it visible to anyone inspecting your network traffic.
- If traffic is restricted within your network, then this risk may not apply
- But keep in mind that downstream services could propagate Baggage outside your network.
- Also, there are no built-in integrity checks to ensure that Baggage items are yours, so exercise caution when reading them.
Baggage is not the same as attributes
unassociated + explicitly - Baggage Span Processors
- An important thing to note about baggage is that it is a separate key-value store
- and is unassociated with attributes on spans, metrics, or logs without explicitly adding them.
- To add baggage entries to attributes, you need to explicitly read the data from baggage and add it as attributes to your spans, metrics, or logs.
- Because a common use cases for Baggage is to add data to Span Attributes across a whole trace
- several languages have Baggage Span Processors that add data from baggage as attributes on span creation.
Instrumentation
How OpenTelemetry facilitates instrumentation
- In order to make a system observable, it must be instrumented
- That is, code from the system’s components must emit traces, metrics, and logs.
- Using OpenTelemetry, you can instrument your code in two primary ways
- Code-based solutions via official APIs and SDKs for most languages
- Zero-code solutions
- Code-based solutions
- allow you to get deeper insight and rich telemetry from your application itself.
- They let you use the OpenTelemetry API to generate telemetry from your application
- which acts as an essential complement to the telemetry generated by zero-code solutions.
- Zero-code solutions
- are great for getting started, or when you can’t modify the application you need to get telemetry out of.
- They provide rich telemetry from libraries you use and/or the environment your application runs in.
- Another way to think of it is that they provide information about what’s happening at the edges of your application.
- You can use both solutions simultaneously.
Additional OpenTelemetry Benefits
- OpenTelemetry provides more than just zero-code and code-based telemetry solutions.
- Libraries can leverage the OpenTelemetry API as a dependency
- which will have no impact on applications using that library, unless the OpenTelemetry SDK is imported.
- For each signal (traces, metrics, logs) you have several methods at your disposals to create, process, and export them.
- With context propagation built into the implementations, you can correlate signals regardless of where they are generated.
- Resources and Instrumentation Scopes allow grouping of signals, by different entities, like, the host, operating system or K8s cluster
- Each language-specific implementation of the API and SDK follows the requirements and expectations of the OpenTelemetry specification.
- Semantic Conventions provide a common naming schema that can be used for standardization across code bases and platforms.
Zero-code
Learn how to add observability to an application without the need to write code - libraries
- As ops you might want to add observability to one or more applications without having to edit the source.
- quickly gain some observability for a service without having to use the OpenTelemetry API & SDK for code-based instrumentation.

- Zero-code instrumentation adds the OpenTelemetry API and SDK capabilities to your application typically as an agent or agent-like installation.
- The specific mechanisms involved may differ by language
- ranging from bytecode manipulation, monkey patching, or eBPF to inject calls to the OpenTelemetry API and SDK into your application.
- Typically, zero-code instrumentation adds instrumentation for the libraries you’re using.
- This means that requests and responses, database calls, message queue calls, and so forth are what are instrumented.
- Your application’s code, however, is not typically instrumented. To instrument your code, you’ll need to use code-based instrumentation.
- Additionally, zero-code instrumentation lets you configure the Instrumentation Libraries and exporters loaded.
- You can configure zero-code instrumentation through environment variables and other language-specific mechanisms
- such as system properties or arguments passed to initialization methods.
- To get started, you only need a service name configured so that you can identify the service in the observability backend of your choice.
- Other configuration options are available, including:
- Data source specific configuration
- Exporter configuration
- Propagator configuration
- Resource configuration
- Automatic instrumentation is available for the following languages:
- .NET
- Go
- Java
- JavaScript
- PHP
- Python
Code-based
Learn the essential steps in setting up code-based instrumentation - application’s code
Import the OpenTelemetry API and SDK
- You’ll first need to import OpenTelemetry to your service code.
- If you’re developing a library or some other component that is intended to be consumed by a runnable binary
- then you would only take a dependency on the API.
- If your artifact is a standalone process or service, then you would take a dependency on the API and the SDK.
| Type | Dependency |
|---|---|
| library | API |
| standalone process or service | API + SDK |
Configure the OpenTelemetry API
- In order to create traces or metrics, you’ll need to first create a tracer and/or meter provider.
- In general, we recommend that the SDK should provide a single default provider for these objects. - factory
- You’ll then get a tracer or meter instance from that provider, and give it a name and version.
- The name you choose here should identify what exactly is being instrumented
- if you’re writing a library, then you should name it after your library as this name will namespace all spans or metric events produced.
- It is also recommended that you supply a version string (i.e., semver:1.0.0) that corresponds to the current version of your library or service.
Configure the OpenTelemetry SDK
- If you’re building a service process
- you’ll also need to configure the SDK with appropriate options for exporting your telemetry data to some analysis backend.
- We recommend that this configuration be handled programmatically through a configuration file or some other mechanism.
- There are also per-language tuning options you may wish to take advantage of.
Create Telemetry Data
- Once you’ve configured the API and SDK
- you’ll then be free to create traces and metric events through the tracer and meter objects you obtained from the provider.
- Make use of Instrumentation Libraries for your dependencies - https://opentelemetry.io/ecosystem/registry/
Export Data
- Once you’ve created telemetry data, you’ll want to send it somewhere.
- OpenTelemetry supports two primary methods of exporting data from your process to an analysis backend
- either directly from a process or by proxying it through the OpenTelemetry Collector.
- In-process export requires you to import and take a dependency on one or more exporters
- libraries that translate OpenTelemetry’s in-memory span and metric objects into the appropriate format for telemetry analysis tools
- In addition, OpenTelemetry supports a wire protocol known as OTLP, which is supported by all OpenTelemetry SDKs.
- This protocol can be used to send data to the OpenTelemetry Collector
- Collector - a standalone binary process that can be run as a proxy or sidecar to your service instances or run on a separate host.
- The Collector can then be configured to forward and export this data to your choice of analysis tools.
Libraries
Learn how to add native instrumentation to your library.
- OpenTelemetry provides instrumentation libraries for many libraries, which is typically done through library hooks or monkey-patching library code.
- Native library instrumentation with OpenTelemetry provides better observability and developer experience for users
- removing the need for libraries to expose and document hooks.
- Other advantages provided by native instrumentation include:
- Custom logging hooks can be replaced by common and easy to use OpenTelemetry APIs, users will only interact with OpenTelemetry.
- Traces, logs, metrics from library and application code are correlated and coherent.
- Common conventions allow users to get similar and consistent telemetry within same technology and across libraries and languages.
- Telemetry signals can be fine tuned (filtered, processed, aggregated) for various consumption scenarios
- using a wide variety of well-documented OpenTelemetry extensibility points.

Semantic conventions
- Semantic conventions are the main source of truth about what information is included on spans produced by
- web frameworks, RPC clients, databases, messaging clients, infrastructure, and more.
- Conventions make instrumentation consistent
- users who work with telemetry don’t have to learn library specifics
- observability vendors can build experiences for a wide variety of technologies, for example databases or messaging systems.
- When libraries follow conventions, many scenarios can be enabled without the user’s input or configuration.
- Semantic conventions are always evolving and new conventions are constantly added.
- Pay special attention to span names: strive to use meaningful names and consider cardinality when defining them.
- Also set the schema_url attribute that you can use to record what version of the semantic conventions you’re using.
Defining spans
- From the perspective of a library user and what the user might be interested in knowing about the behavior and activity of the library.
- As the library maintainer, you know the internals
- but the user will most likely be less interested in the inner workings of the library and more interested in the functionality of their application.
- Think about what information can be helpful in analyzing the usage of your library, then think about an appropriate way to model that data.
- Some aspects to consider include
- Spans and span hierarchies
- Numerical attributes on spans, as an alternative to aggregated metrics
- Span events
- Aggregated Metrics
- For example, if your library is making requests to a database, create spans only for the logical request to the database.
- The physical requests over the network should be instrumented within the libraries implementing that functionality.
- You should also favor capturing other activities, like object/data serialization as span events, rather than as additional spans.
- Follow the semantic conventions when setting span attributes.
When not to instrument
only instrument your library at its own level + When in doubt, don’t instrument
- Some libraries are thin clients wrapping network calls.
- Chances are that OpenTelemetry has an instrumentation library for the underlying RPC client.
- https://opentelemetry.io/ecosystem/registry/
- If a library exists, instrumenting the wrapper library might not be necessary.
- As a general guideline, only instrument your library at its own level.
- Don’t instrument if all the following cases apply
- Your library is a thin proxy on top of documented or self-explanatory APIs.
- OpenTelemetry has instrumentation for underlying network calls.
- There are no conventions your library should follow to enrich telemetry.
- When in doubt, don’t instrument.
- If you choose not to instrument, still be useful to provide a way to configure OpenTelemetry handlers for your internal RPC client instance.
- It’s essential in languages that don’t support fully automatic instrumentation and still useful in others.
OpenTelemetry API
- The first step when instrumenting an application is to include the OpenTelemetry API package as a dependency.
- OpenTelemetry has two main modules: API and SDK.
- OpenTelemetry API is a set of abstractions and non-operational implementations.
- Unless your application imports the OpenTelemetry SDK
- your instrumentation does nothing and does not impact application performance.
Libraries should only use the OpenTelemetry API
If you’re concerned about adding new dependencies, here are some considerations to help you decide how to minimize dependency conflicts
- OpenTelemetry Trace API reached stability in early 2021. It follows Semantic Versioning 2.0.
- Use the earliest stable OpenTelemetry API (1.0.*) and avoid updating it unless you have to use new features.
- While your instrumentation stabilizes, consider shipping it as a separate package, so that it never causes issues for users who don’t use it.
- Semantic conventions are stable, but subject to evolution
- while this does not cause any functional issues, you might need to update your instrumentation every once in a while.
- Having it in a preview plugin or in OpenTelemetry contrib repository
- may help keeping conventions up-to-date without breaking changes for your users.
Getting a tracer
- All application configuration is hidden from your library through the Tracer API.
- Libraries might allow applications to pass instances of TracerProvider to facilitate dependency injection and ease of testing
- or obtain it from global TracerProvider.
- OpenTelemetry language implementations might have different preferences for passing instances or accessing the global
- based on what’s idiomatic in each programming language.
- When obtaining the tracer, provide your library (or tracing plugin) name and version
- they show up on the telemetry and help users process and filter telemetry
- understand where it came from, and debug or report instrumentation issues.
What to instrument
Public APIs
- Public APIs are good candidates for tracing
- spans created for public API calls allow users to map telemetry to application code, understand the duration and outcome of library calls.
- Which calls to trace include
- Public methods that make network calls internally or local operations that take significant time and may fail, for example I/O.
- Handlers that process requests or messages.
- Follow conventions to populate attributes.
The following example shows how to instrument a Java application:
1 | private static Tracer tracer = getTracer(TracerProvider.noop()); |
Nested network and other spans

- Network calls are usually traced with OpenTelemetry auto-instrumentations through corresponding client implementation.
- If OpenTelemetry does not support tracing your network client, here are some considerations to help you decide the best course of action:
- Would tracing network calls improve observability for users or your ability to support them?
- Is your library a wrapper on top of public, documented RPC API?
- Would users need to get support from the underlying service in case of issues?
- Instrument the library and make sure to trace individual network tries.
- Would tracing those calls with spans be very verbose? or would it noticeably impact performance?
- Use logs with verbosity or span events
- logs can be correlated to parent (public API calls)
- while span events should be set on public API span.
- If they have to be spans (to carry and propagate unique trace context)
- put them behind a configuration option and disable them by default.
- Use logs with verbosity or span events
- If OpenTelemetry already supports tracing your network calls, you probably don’t want to duplicate it. There might be some exceptions:
- To support users without auto-instrumentation
- which might not work in certain environments or when users have concerns with monkey-patching.
- To enable custom or legacy correlation and context propagation protocols with underlying service.
- Enrich RPC spans with essential library or service-specific information not covered by auto-instrumentation.
- To support users without auto-instrumentation
A generic solution to avoid duplication is under construction.
Events
- Traces are a kind of signal that your apps can emit. Events (or logs) and traces complement, not duplicate, each other.
- Whenever you have something that should have a certain level of verbosity, logs are a better choice than traces.
- If your app uses logging or some similar module, the logging module might already have OpenTelemetry integration.
- To find out, see the registry. - https://opentelemetry.io/ecosystem/registry/
- Integrations usually stamp active trace context on all logs, so users can correlate them.
- If your language and ecosystem don’t have common logging support, use span events to share additional app details.
- Events maybe more convenient if you want to add attributes as well.
- As a rule of thumb, use events or logs for verbose data instead of spans.
- Always attach events to the span instance that your instrumentation created.
- Avoid using the active span if you can, since you don’t control what it refers to.
Context propagation
Extracting context
- If you work on a library or a service that receives upstream calls
- such as a web framework or a messaging consumer,extract context from the incoming request or message.
- OpenTelemetry provides the Propagator API, which hides specific propagation standards and reads the trace Context from the wire.
- In case of a single response, there is just one context on the wire, which becomes the parent of the new span the library creates.
- After you create a span, pass new trace context to the application code (callback or handler), by making the span active;
- if possible, do this explicitly.
- In the case of a messaging system, you might receive more than one message at once.
- Received messages become links on the span you create.
The following Java example shows how to add trace context and activate a span.
1 | // extract the context |
Injecting context
- When you make an outbound call, you usually want to propagate context to the downstream service.
- In this case, create a new span to trace the outgoing call and use Propagator API to inject context into the message.
- There might be other cases where you might want to inject context, for example when creating messages for async processing.
The following Java example shows how to propagate context.
1 | Span span = tracer.spanBuilder("send") |
There might be some exceptions where you don’t need to propagate context
- Downstream service does not support metadata or prohibits unknown fields.
- Downstream service does not define correlation protocols.
- Consider adding support for context propagation in a future version.
- Downstream service supports custom correlation protocol.
- Best effort with custom propagator
- use OpenTelemetry trace context if compatible or generate and stamp custom correlation IDs on the span.
In-process
- Make your spans active or current, as this enables correlating spans with logs and any nested auto-instrumentations.
- If the library has a notion of context, support optional explicit trace context propagation in addition to active spans. - Go
- Put spans (trace context) created by library in the context explicitly, document how to access it.
- Allow users to pass trace context in your context.
- Within the library, propagate trace context explicitly. Active spans might change during callbacks.
- Capture active context from users on the public API surface as soon as you can, use it as a parent context for your spans.
- Pass context around and stamp attributes, exceptions, events on explicitly propagated instances.
- This is essential if you start threads explicitly
- do background processing or other things that can break due to async context flow limitations in your language. - Java
Additional considerations
Instrumentation registry
- Add your instrumentation library to the OpenTelemetry registry so users can find it.
Performance
- OpenTelemetry API is no-op and very performant when there is no SDK in the application.
- When OpenTelemetry SDK is configured, it consumes bound resources.
- Real-life applications, especially on the high scale, would frequently have head-based sampling configured.
- Sampled-out spans are affordable
- and you can check if the span is recording to avoid extra allocations and potentially expensive calculations while populating attributes.
- The following Java example shows to provide attributes for sampling and check span recording.
1 | // some attributes are important for sampling, they should be provided at creation time |
Error handling
- OpenTelemetry API does not fail on invalid arguments, never throws, and swallows exceptions, which means it’s forgiving at runtime.
- This way instrumentation issues do not affect application logic. Test the instrumentation to notice issues OpenTelemetry hides at runtime.
Testing
- Since OpenTelemetry has a variety of auto-instrumentations, try how your instrumentation interacts with other telemetry
- incoming requests, outgoing requests, logs, and so on.
- Use a typical application, with popular frameworks and libraries and all tracing enabled when trying out your instrumentation.
- For unit testing, you can usually mock or fake SpanProcessor and SpanExporter as in the following Java example:
1 |
|
组件
OpenTelemetry 让你无需使用特定供应商的 SDK 和工具就能生成和导出遥测数据 - 避免厂商锁定
规范
本节说明了针对所有实现的跨语言要求和期望。除了术语定义之外,规范还定义了以下内容
| Component | Desc |
|---|---|
| API | 定义了用于生成和关联跟踪、指标和日志数据的数据类型和操作 |
| SDK | 定义了 API 特定语言实现的要求 - 配置、数据处理和导出概念也在这里定义 |
| 数据 | 定义了 OpenTelemetry 协议(OTLP)和与供应商无关的、遥测后端可以提供支持的语义约定 |
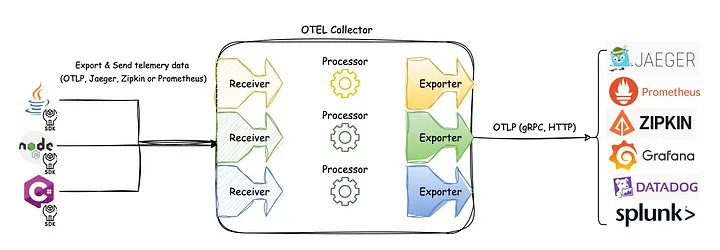
Collector
- OpenTelemetry Collector 是一个与供应商无关的代理,可以接收、处理和导出遥测数据
- 支持以多种格式接收遥测数据(例如 OTLP、Jaeger、Prometheus 以及许多商业/专有工具)并将数据发送到一个或多个后端
- 支持在导出之前处理和过滤遥测数据
API + SDK
- OpenTelemetry 还提供语言 SDK,允许你使用所选语言的 OpenTelemetry API 生成遥测数据,并将这些数据导出到首选后端
- 这些 SDK 还允许你结合常见库和框架的插桩库,以便你可以将其用于应用程序中的手动插桩
插桩库
- OpenTelemetry 支持通过大量组件来为所支持的语言根据流行的库和框架生成相关遥测数据
- 来自 HTTP 库的入站和出站 HTTP 请求将生成有关这些请求的数据
- 让流行的库能够开箱即用地进行观测而无需拉入独立的组件中是一个长期目标
导出器
- Send telemetry to the OpenTelemetry Collector to make sure it’s exported correctly.
- Using the Collector in production environments is a best practice.
- To visualize your telemetry, export it to a backend such as Jaeger, Zipkin, Prometheus, or a vendor-specific backend.
- Among exporters, OTLP exporters are designed with the OpenTelemetry data model in mind, emitting OTel data without any loss of information.
- many tools that operate on telemetry data support OTLP (such as Prometheus, Jaeger, and most vendors)
- providing you with a high degree of flexibility when you need it.
零代码插桩
- 如果适用,OpenTelemetry 的特定语言实现将提供一种无需修改源代码即可对应用程序进行插桩的方法
- 虽然底层机制取决于使用的语言,但至少会将 OpenTelemetry API 和 SDK 能力添加到你的应用程序中
- 此外,它们还可能添加一组插桩库和导出器依赖项
资源检测器
- 资源以资源属性表示生成遥测数据的实体
- 在 Kubernetes 上运行的容器中生成遥测数据的进程具有 Pod 名称、命名空间和可能的 Deployment 名称 - 这三个属性都可以包含在资源中
- 特定语言实现提供了从环境变量 OTEL_RESOURCE_ATTRIBUTES 和许多常见实体(如进程运行时、服务、主机或操作系统)中检测资源的功能
跨服务传播器
- 传播是一种用于跨服务和进程边界传递信息的机制
- 虽然不限于跟踪,但它是允许跟踪在跨越进程和网络边界的服务中建立系统因果关系的信息
- 对于绝大多数场景,上下文传播是通过插桩库为你完成的
- 但如果需要,你可以自己使用 Propagators 来序列化和反序列化跨领域的关注点, 例如 span 的上下文和 baggage
采样器
- 采样是限制系统生成跟踪数量的过程,特定语言的实现提供了几种头部采样器
K8s Operator
- OpenTelemetry Operator 是 Kubernetes Operator 的一种实现
- Operator 管理 OpenTelemetry Collector 以及使用 OpenTelemetry 对工作负载进行自动插桩
函数即服务资产
- OpenTelemetry 支持多种由不同云服务商提供的函数即服务的监控方法
- 社区目前提供预构建的 Lambda 层,能够自动对你的应用进行插桩, 另外在手动或自动对应用进行插桩时可以使用的独立 Collector Lambda 层选项
语义约定
- OpenTelemetry 定义了语义约定, 为不同类型的操作和数据指定通用名称
- 使用语义约定的好处是遵循通用的命名方案,可以在代码库、库和平台之间实现标准化
- 语义约定适用于链路追踪、指标、日志和资源
Resources
Introduction
- A resource represents the entity producing telemetry as resource attributes.
- For example, a process producing telemetry that is running in a container on Kubernetes
- has a process name, a pod name, a namespace, and possibly a deployment name.
- All four of these attributes can be included in the resource.
- In your observability backend, you can use resource information to better investigate interesting behavior.
- if your trace or metrics data indicate latency in your system, you can narrow it down to a specific container, pod, or Kubernetes deployment.
- A resource is added to the TraceProvider or MetricProvider when they are created during initialization. This association cannot be changed later.
- After a resource is added, all spans and metrics produced from a Tracer or Meter from the provider will have the resource associated with them.
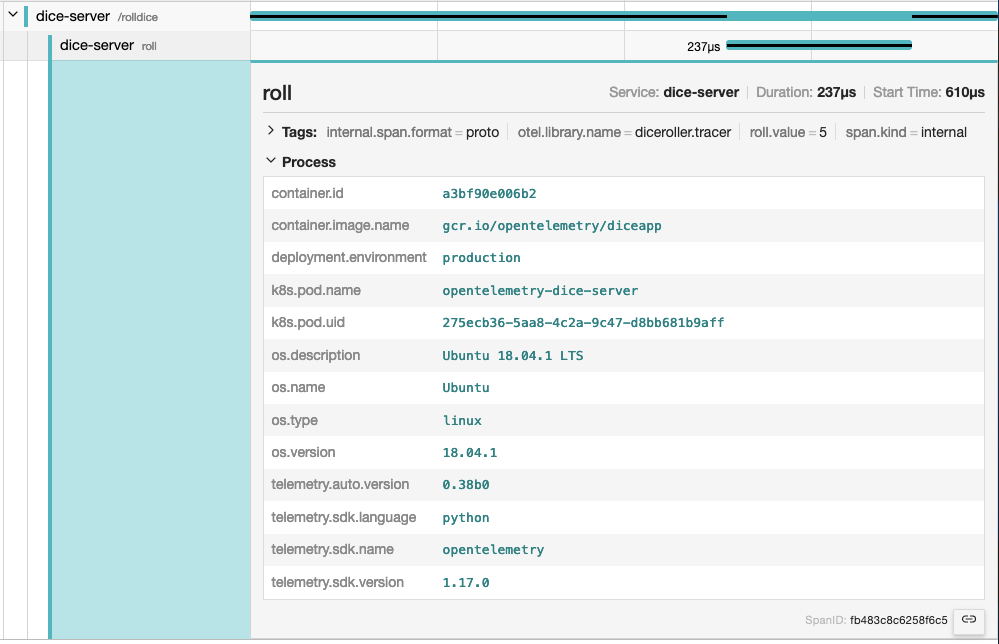
If you use Jaeger as your observability backend, resource attributes are grouped under the Process tab
Semantic Attributes with SDK-provided Default Value
- There are attributes provided by the OpenTelemetry SDK.
- One of them is the service.name, which represents the logical name of the service.
- By default, SDKs will assign the value unknown_service for this value
- so it is recommended to set it explicitly, either in code or via setting the environment variable OTEL_SERVICE_NAME.
- Additionally, the SDK will also provides the following resource attributes to identify itself
- telemetry.sdk.name
- telemetry.sdk.language
- telemetry.sdk.version
Resource Detectors
- Most language-specific SDKs provide a set of resource detectors that can be used to automatically detect resource information from the environment.
- Common resource detectors include
- Operating System
- Host
- Process and Process Runtime
- Container
- Kubernetes
- Cloud-Provider-Specific Attributes
Custom resources
- You can also provide your own resource attributes.
- You can either provide them in code or via populating the environment variable OTEL_RESOURCE_ATTRIBUTES.
- If applicable, use the semantic conventions for your resource attributes.
- For example, you can provide the name of your deployment environment using deployment.environment
1 | env OTEL_RESOURCE_ATTRIBUTES=deployment.environment=production yourApp |
Instrumentation scope
- The Instrumentation scope represents a logical unit within the application code with which the emitted telemetry can be associated.
- Developers can decide what denotes a reasonable instrumentation scope.
- For example, they can select a module, a package, or a class as the instrumentation scope.
- In the case of a library or framework, a common approach is to use an identifier as scope that is unique to the library or framework
- such as a fully qualified name and version of the library or framework.
- If the library itself doesn’t have built-in OpenTelemetry instrumentation, and an instrumentation library is used instead
- use the name and version of the instrumentation library as the instrumentation scope.
- The instrumentation scope is defined by a name and version pair when a tracer, meter or logger instance is obtained from a provider.
- Each span, metric, or log record created by the instance is then associated with the provided instrumentation scope.
- In your observability backend, scoping allows you to slice and dice your telemetry data by scope
- for example to see which of your users are using which version of a library
- what the performance of that library version is
- to pin point a problem to a specific module of your application.
- The following diagram illustrates a trace with multiple instrumentation scopes. The different scopes are represented by different colors
- At the top the /api/placeOrder span is generated by the used HTTP framework.
- The spans in green (CheckoutService::placeOrder, prepareOrderItems and checkout) are application code, grouped by the CheckoutService class.
- The spans for CartService::getCart and ProductService::getProduct are also application code
- grouped by the CartService and ProductService classes.
- The spans in orange (Cache::find) and light blue (DB::query) are library code, grouped by the library name and version.

Sampling
Learn about sampling and the different sampling options available in OpenTelemetry.
- With traces, you can observe requests as they move from one service to another in a distributed system.
- Tracing is highly practical for both high-level and in-depth analysis of systems.
- However, if the large majority of your requests are successful and finish with acceptable latency and no errors
- you do not need 100% of your traces to meaningfully observe your applications and systems. You just need the right sampling.

Terminology
- It’s important to use consistent terminology when discussing sampling.
- A trace or span is considered “sampled” or “not sampled”
- Sampled
- A trace or span is processed and exported.
- Because it is chosen by the sampler as a representative of the population, it is considered “sampled”.
- Not sampled
- A trace or span is not processed or exported.
- Because it is not chosen by the sampler, it is considered “not sampled”.
- Sampled
Why sampling?
- Sampling is one of the most effective ways to reduce the costs of observability without losing visibility.
- Although there are other ways to lower costs, such as filtering or aggregating data
- these other methods do not adhere to the concept of representativeness
- which is crucial when performing in-depth analysis of application or system behavior.
- Representativeness is the principle that a smaller group can accurately represent a larger group.
- Additionally, representativeness can be mathematically verified
- meaning that you can have high confidence that a smaller sample of data accurately represents the larger group.
- Additionally, the more data you generate, the less data you actually need to have a representative sample.
- For high-volume systems, is quite common for a sampling rate of 1% or lower to very accurately represent the other 99% of data.
When to sample
- Consider sampling if you meet any of the following criteria:
- You generate 1000 or more traces per second.
- Most of your trace data represents healthy traffic with little variation in data.
- You have some common criteria, like errors or high latency, that usually means something is wrong.
- You have domain-specific criteria you can use to determine relevant data beyond errors and latency.
- You can describe some common rules that determine if data should be sampled or dropped.
- You have a way to tell your services apart, so that high- and low-volume services are sampled differently.
- You have the ability to route unsampled data (for “just in case” scenarios) to low-cost storage systems.
- Finally, consider your overall budget.
- If you have limited budget for observability, but can afford to spend time to effectively sample, then sampling can generally be worth it.
When not to sample
- Sampling might not be appropriate for you. You might want to avoid sampling if you meet any of the following criteria:
- You generate very little data (tens of small traces per second or lower).
- You only use observability data in aggregate, and can thus pre-aggregate data.
- You are bound by circumstances such as regulation that prohibit dropping data (and cannot route unsampled data to low-cost storage).
- Finally, consider the following three costs associated with sampling:
- The direct cost of compute to effectively sample data, such as a tail sampling proxy.
- The indirect engineering cost of maintaining effective sampling methodologies as more application, systems, and data are involved.
- The indirect opportunity cost of missing critical information with ineffective sampling techniques.
- Sampling, while effective at reducing observability costs, might introduce other unexpected costs if not performed well.
- It could be cheaper to allocate more resources for observability instead, either with a vendor or compute when self-hosting
- depending on your observability backend, the nature of your data, and your attempts to sample effectively.
Head Sampling
- Head sampling is a sampling technique used to make a sampling decision as early as possible.
- A decision to sample or drop a span or trace is not made by inspecting the trace as a whole.
- For example, the most common form of head sampling is Consistent Probability Sampling.
- This is also be referred to as Deterministic Sampling.
- In this case, a sampling decision is made based on the trace ID and the desired percentage of traces to sample.
- This ensures that whole traces are sampled - no missing spans - at a consistent rate, such as 5% of all traces
- The upsides to head sampling are:
- Easy to understand
- Easy to configure
- Efficient
- Can be done at any point in the trace collection pipeline
- The primary downside to head sampling is that it is not possible to make a sampling decision based on data in the entire trace.
- For example, you cannot ensure that all traces with an error within them are sampled with head sampling alone.
- For this situation and many others, you need tail sampling.
Tail Sampling
- Tail sampling is where the decision to sample a trace takes place by considering all or most of the spans within the trace.
- Tail Sampling gives you the option to sample your traces based on specific criteria derived from different parts of a trace
- which isn’t an option with Head Sampling.

- Some examples of how you can use Tail Sampling include:
- Always sampling traces that contain an error
- Sampling traces based on overall latency
- Sampling traces based on the presence or value of specific attributes on one or more spans in a trace
- for example, sampling more traces originating from a newly deployed service
- Applying different sampling rates to traces based on certain criteria
- such as when traces only come from low-volume services versus traces with high-volume services.
- As you can see, tail sampling allows for a much higher degree of sophistication in how you sample data.
- For larger systems that must sample telemetry
- it is almost always necessary to use Tail Sampling to balance data volume with the usefulness of that data.
- There are three primary downsides to tail sampling today:
- Tail sampling can be difficult to implement.
- Depending on the kind of sampling techniques available to you, it is not always a “set and forget” kind of thing.
- As your systems change, so too will your sampling strategies.
- For a large and sophisticated distributed system, rules that implement sampling strategies can also be large and sophisticated.
- Tail sampling can be difficult to operate.
- The component(s) that implement tail sampling must be stateful systems that can accept and store a large amount of data.
- Depending on traffic patterns, this can require dozens or even hundreds of compute nodes that all utilize resources differently.
- Furthermore, a tail sampler might need to “fall back” to less computationally intensive sampling techniques
- if it is unable to keep up with the volume of data it is receiving.
- it is critical to monitor tail-sampling components to ensure that they have the resources they need to make the correct sampling decisions.
- Tail samplers often end up as vendor-specific technology today.
- If you’re using a paid vendor for Observability
- the most effective tail sampling options available to you might be limited to what the vendor offers.
- Tail sampling can be difficult to implement.
- Finally, for some systems, tail sampling might be used in conjunction with Head Sampling.
- a set of services that produce an extremely high volume of trace data might first use head sampling to sample only a small percentage of traces
- and then later in the telemetry pipeline use tail sampling to make more sophisticated sampling decisions before exporting to a backend.
- This is often done in the interest of protecting the telemetry pipeline from being overloaded.
Support
Collector
The OpenTelemetry Collector includes the following sampling processors:
- Probabilistic Sampling Processor
- Tail Sampling Processor
Language SDKs
- https://opentelemetry.io/zh/docs/languages/go/sampling/
- https://opentelemetry.io/zh/docs/languages/js/sampling/
Vendors
- Many vendors offer comprehensive sampling solutions
- that incorporate head sampling, tail sampling, and other features that can support sophisticated sampling needs.
- These solutions may also be optimized specifically for the vendor’s backend.
- If you are sending telemetry to a vendor, consider using their sampling solutions.
Distributions
A distribution, not to be confused with a fork, is customized version of an OpenTelemetry component.
- The OpenTelemetry projects consists of multiple components that support multiple signals.
- Any reference implementation can be customized as a distribution.
What is a distribution?
- A distribution is a customized version of an OpenTelemetry component.
- A distribution is a wrapper around an upstream OpenTelemetry repository with some customizations.
- Distributions are not to be confused with forks.
- Customizations in a distribution may include:
- Scripts to ease use or customize use for a specific backend or vendor
- Changes to default settings required for a backend, vendor, or end-user
- Additional packaging options that may be vendor or end-user specific
- Test, performance, and security coverage beyond what OpenTelemetry provides
- Additional capabilities beyond what OpenTelemetry provides
- Less capabilities from what OpenTelemetry provides
- Distributions broadly fall into the following categories:
- Pure
- These distributions provide the same functionality as upstream and are 100% compatible.
- Customizations typically enhance the ease of use or packaging.
- These customizations may be backend, vendor, or end-user specific.
- Plus
- These distributions provide added functionalities on top of upstream through additional components.
- Examples include instrumentation libraries or vendor exporters not upstreamed to the OpenTelemetry project.
- Minus
- These distributions provide a subset of functionality from upstream.
- Examples of this include the removal of
- instrumentation libraries
- receivers, processors, exporters, or extensions found in the OpenTelemetry Collector project.
- These distributions may be provided to increase supportability and security considerations.
- Pure
Who can create a distribution?
- Anyone can create a distribution. Today, several vendors offer distributions.
- end-users can consider creating a distribution
- if they want to use components in the Registry that are not upstreamed to the OpenTelemetry project.
Contribution or distribution?
- Before you read on and learn how you can create your own distribution
- ask yourself if your additions on top of an OpenTelemetry component would be beneficial for everyone
- and therefore should be included in the reference implementations:
- Can your scripts for “ease of use” be generalized?
- Can your changes to default settings be the better option for everyone?
- Are your additional packaging options really specific?
- Might your test, performance and security coverage work with the reference implementation as well?
- Have you checked with the community if your additional capabilities could be part of the standard?
Glossary
Definitions and conventions for telemetry terms as used in OpenTelemetry.
- This glossary defines terms and concepts that are new to the OpenTelemetry project
- and clarifies OpenTelemetry-specific uses of terms common in the observability field.
Aggregation
- The process of combining multiple measurements into exact or estimated statistics about the measurements
- that took place during an interval of time, during program execution.
- Used by the Metric Data source.
API
- Application Programming Interface.
- In the OpenTelemetry project, used to define how telemetry data is generated per Data source.
Application
- One or more Services designed for end users or other applications.
APM
- Application Performance Monitoring is about monitoring software applications
- their performance (speed, reliability, availability, and so on) to detect issues, alerting and tooling for finding the root cause.
Attribute
- OpenTelemetry term for Metadata.
- Adds key-value information to the entity producing telemetry.
- Used across Signals and Resources
Automatic instrumentation
- Refers to telemetry collection methods that do not require the end-user to modify application’s source code.
- Methods vary by programming language, and examples include bytecode injection or monkey patching.
Baggage
- A mechanism for propagating Metadata to help establish a causal relationship between events and services.
Client library
- See Instrumented library.
Client-side app
- A component of an Application that is not running inside a private infrastructure and is typically used directly by end-users.
- Examples of client-side apps are browser apps, mobile apps, and apps running on IoT devices.
Collector
- The OpenTelemetry Collector, or Collector for short, is a vendor-agnostic implementation on how to receive, process, and export telemetry data.
- A single binary that can be deployed as an agent or gateway.
- Spelling: When referring to the OpenTelemetry Collector, always capitalize Collector.
- Use just “Collector” if you are using Collector as an adjective — for example, “Collector configuration”.
Contrib
core - Instrumentation Libraries + Collector
non-core - vendor Exporter
- Several Instrumentation Libraries and the Collector offer a set of core capabilities
- as well as a dedicated contrib repository for non-core capabilities including vendor Exporters.
Context propagation
- Allows all Data sources to share an underlying context mechanism for storing state and accessing data across the lifespan of a Transaction.
DAG
- Directed acyclic graph
Data source
- See Signal
Dimension
- A term used specifically by Metrics. See Attribute.
Distributed tracing
- Tracks the progression of a single Request, called a Trace, as it is handled by Services that make up an Application.
- A Distributed trace transverses process, network and security boundaries.
Distribution
- A distribution is a wrapper around an upstream OpenTelemetry repository with some customizations.
Event
- Something that happened where representation depends on the Data source. For example, Spans.
Exporter
- Provides functionality to emit telemetry to consumers. Exporters can be push- or pull-based.
Field
Log Records
- A term used specifically by Log Records.
- Metadata can be added through defined fields, including Attributes and Resource.
- Other fields may also be considered Metadata, including severity and trace information. See the field spec.
gRPC
- A high-performance, open source universal RPC framework.
Instrumented library
- Denotes the Library for which the telemetry signals (Traces, Metrics, Logs) are gathered.
Instrumentation library
- Denotes the Library that provides the instrumentation for a given Instrumented library.
- Instrumented library and Instrumentation library can be the same Library if it has built-in OpenTelemetry instrumentation.
Label
- A term used specifically by Metrics. See Metadata.
Library
- A language-specific collection of behavior invoked by an interface.
Log
- Sometimes used to refer to a collection of Log records.
- Can be ambiguous since people also sometimes use Log to refer to a single Log record.
- Where ambiguity is possible, use additional qualifiers, for example, Log record.
Log record
- A recording of an Event.
- record includes a timestamp indicating when the Event happened as well as other data that describes what happened, where it happened, and so on.
Metadata
Metrics - Labels
Logs - Fields
- A key-value pair, for example foo=”bar”, added to an entity producing telemetry.
- OpenTelemetry calls these pairs Attributes.
- In addition, Metrics have Dimensions an Labels, while Logs have Fields.
Metric
time series
- Records a data point, either raw measurements or predefined aggregation, as time series with Metadata.
OC
- Short form for OpenCensus.
OT
- Short form for OpenTracing.
OTel
- Short form for OpenTelemetry.
- Spelling: Write OTel, not OTEL.
OpAMP
- Abbreviation for the Open Agent Management Protocol.
- Spelling - Write OpAMP, not OPAMP nor opamp in descriptions or instructions.
OpenCensus
- Precursor to OpenTelemetry.
OpenTracing
- Precursor to OpenTelemetry.
OpenTelemetry
- Formed through a merger of the OpenTracing and OpenCensus projects
- a collection of APIs, SDKs, and tools that you can use to instrument, generate, collect, and export telemetry data such as metrics, logs, and traces.
- Spelling: OpenTelemetry should always be a single unhyphenated word and capitalized as shown.
OTelCol
- Short form for OpenTelemetry Collector.
OTEP
- An acronym for OpenTelemetry Enhancement Proposal
- Spelling: Write “OTEPs” as plural form. Don’t write OTep or otep in descriptions.
OTLP
- Short for OpenTelemetry Protocol.
Propagators
- Used to serialize and deserialize specific parts of telemetry data such as span context and Baggage in Spans.
Proto
OpenTelemetry protocol (OTLP) specification and Protobuf definitions
- Language independent interface types.
Receiver
- The term used by the Collector to define how telemetry data is received. Receivers can be push- or pull-based.
Resource
- Captures information about the entity producing telemetry as Attributes.
- a process producing telemetry that is running in a container on Kubernetes
- has a process name, a pod name, a namespace, and possibly a deployment name.
- All these attributes can be included in the Resource.
REST
- Short for Representational State Transfer
RPC
- Short for Remote Procedure Call
Sampling
- A mechanism to control the amount of data exported.
- Most commonly used with the Tracing Data Source.
SDK
- Short for Software Development Kit.
- Refers to a telemetry SDK that denotes a Library that implement the OpenTelemetry API.
Semantic conventions
- Defines standard names and values of Metadata in order to provide vendor-agnostic telemetry data.
Service
- A component of an Application.
- Multiple instances of a Service are typically deployed for high availability and scalability.
- A Service can be deployed in multiple locations.
Signal
- One of Traces, Metrics or Logs.
Span
- Represents a single operation within a Trace.
Span link
- A span link is a link between causally-related spans.
Specification
- Describes the cross-language requirements and expectations for all implementations.
Status
- The result of the operation.
- Typically used to indicate whether an error occurred.
Tag
- See Metadata
Trace
- A DAG of Spans, where the edges between Spans are defined as parent-child relationship.
Tracer
- Responsible for creating Spans.
Transaction
- See Distributed Tracing.
zPages
development + debug
- An in-process alternative to external exporters.
- When included, they collect and aggregate tracing and metrics information in the background
- this data is served on web pages when requested.
演示
TBD
Language APIs & SDKs
zero-code solutions - Go, .NET, PHP, Python, Java and JavaScript
- OpenTelemetry code instrumentation is supported for the languages listed in the Statuses and Releases table below.
- Unofficial implementations for other languages are available as well. You can find them in the registry.
- For Go, .NET, PHP, Python, Java and JavaScript you can use zero-code solutions to add instrumentation to your application without code changes.
- If you are using Kubernetes, you can use the OpenTelemetry Operator for Kubernetes to inject these zero-code solutions into your application.
Status and Releases - The current status of the major functional components for OpenTelemetry is as follows:
Regardless of an API/SDK’s status, if your instrumentation relies on semantic conventions that are marked as Experimental in the semantic conventions specification, your data flow might be subject to breaking changes.
| Language | Traces | Metrics | Logs | Notes |
|---|---|---|---|---|
| C++ | Stable | Stable | Stable | |
| C#/.NET | Stable | Stable | Stable | |
| Go | Stable | Stable | Beta | |
| Java | Stable | Stable | Stable | |
| JavaScript | Stable | Stable | Development | Node.js & Browser |
| PHP | Stable | Stable | Stable | |
| Python | Stable | Stable | Development |
API references
- Special Interest Groups (SIGs) implementing the OpenTelemetry API and SDK in a specific language also publish API references for developers.
SDK Configuration
- OpenTelemetry SDKs support configuration in each language and with environment variables.
- Values set with environment variables override equivalent configuration in code using SDK APIs.
General
Support for environment variables is optional
| Feature | Go | Java | JS | Python | Ruby | Erlang | PHP | Rust | C++ | .NET | Swift |
|---|---|---|---|---|---|---|---|---|---|---|---|
| OTEL_SDK_DISABLED | - | + | - | + | - | - | + | - | - | - | - |
| OTEL_RESOURCE_ATTRIBUTES | + | + | + | + | + | + | + | + | + | + | - |
| OTEL_SERVICE_NAME | + | + | + | + | + | + | + | + | + | ||
| OTEL_LOG_LEVEL | - | - | + | [-][py1059] | + | - | + | - | - | - | |
| OTEL_PROPAGATORS | - | + | + | + | + | + | - | - | - | - | |
| OTEL_BSP_* | + | + | + | + | + | + | + | + | - | + | - |
| OTEL_BLRP_* | + | + | - | + | |||||||
| OTEL_EXPORTER_OTLP_* | + | + | + | + | + | + | + | + | + | - | |
| OTEL_EXPORTER_ZIPKIN_* | - | + | + | + | - | + | - | - | + | - | |
| OTEL_TRACES_EXPORTER | - | + | + | + | + | + | + | - | - | - | |
| OTEL_METRICS_EXPORTER | - | + | + | - | - | + | - | - | - | - | |
| OTEL_LOGS_EXPORTER | - | + | + | + | - | - | |||||
| OTEL_SPAN_ATTRIBUTE_COUNT_LIMIT | + | + | + | + | + | + | + | + | - | + | |
| OTEL_SPAN_ATTRIBUTE_VALUE_LENGTH_LIMIT | + | + | + | + | + | + | + | - | + | ||
| OTEL_SPAN_EVENT_COUNT_LIMIT | + | + | + | + | + | + | + | + | - | + | |
| OTEL_SPAN_LINK_COUNT_LIMIT | + | + | + | + | + | + | + | + | - | + | |
| OTEL_EVENT_ATTRIBUTE_COUNT_LIMIT | + | - | + | + | + | + | - | + | |||
| OTEL_LINK_ATTRIBUTE_COUNT_LIMIT | + | - | + | + | + | + | - | + | |||
| OTEL_LOGRECORD_ATTRIBUTE_COUNT_LIMIT | + | - | |||||||||
| OTEL_LOGRECORD_ATTRIBUTE_VALUE_LENGTH_LIMIT | + | - | |||||||||
| OTEL_TRACES_SAMPLER | + | + | + | + | + | + | + | - | - | - | |
| OTEL_TRACES_SAMPLER_ARG | + | + | + | + | + | + | + | - | - | - | |
| OTEL_ATTRIBUTE_VALUE_LENGTH_LIMIT | + | + | + | + | + | - | + | - | + | ||
| OTEL_ATTRIBUTE_COUNT_LIMIT | + | + | + | + | + | - | + | - | + | ||
| OTEL_METRIC_EXPORT_INTERVAL | - | + | + | + | - | + | |||||
| OTEL_METRIC_EXPORT_TIMEOUT | - | - | + | + | - | + | |||||
| OTEL_METRICS_EXEMPLAR_FILTER | - | + | + | - | + | ||||||
| OTEL_EXPORTER_OTLP_METRICS_TEMPORALITY_PREFERENCE | + | + | + | + | + | - | + | ||||
| OTEL_EXPORTER_OTLP_METRICS_DEFAULT_HISTOGRAM_AGGREGATION | + | + | - | ||||||||
| OTEL_EXPERIMENTAL_CONFIG_FILE | - |
OTEL_SERVICE_NAME
- Sets the value of the service.name resource attribute.
- Default value - unknown_service
- If service.name is also provided in OTEL_RESOURCE_ATTRIBUTES, then OTEL_SERVICE_NAME takes precedence.
- export OTEL_SERVICE_NAME=”your-service-name”
OTEL_RESOURCE_ATTRIBUTES
- Key-value pairs to be used as resource attributes.
- Default value - Empty
- See Resource semantic conventions for semantic conventions to follow for common resource types.
- export OTEL_RESOURCE_ATTRIBUTES=”key1=value1,key2=value2“
OTEL_TRACES_SAMPLER
- Specifies the Sampler used to sample traces by the SDK.
- Default value - parentbased_always_on
- export OTEL_TRACES_SAMPLER=”traceidratio”
Accepted values for OTEL_TRACES_SAMPLER are:
| Options | Desc |
|---|---|
| always_on | AlwaysOnSampler |
| always_off | AlwaysOffSampler |
| traceidratio | TraceIdRatioBased |
| parentbased_always_on | ParentBased(root=AlwaysOnSampler) |
| parentbased_always_off | ParentBased(root=AlwaysOffSampler) |
| parentbased_traceidratio | ParentBased(root=TraceIdRatioBased) |
| parentbased_jaeger_remote | ParentBased(root=JaegerRemoteSampler) |
| jaeger_remote | JaegerRemoteSampler |
| xray | AWS X-Ray Centralized Sampling - third party |
OTEL_TRACES_SAMPLER_ARG
- Specifies arguments, if applicable, to the sampler defined in by OTEL_TRACES_SAMPLER.
- The specified value will only be used if OTEL_TRACES_SAMPLER is set.
- Each Sampler type defines its own expected input, if any.
- Invalid or unrecognized input is logged as an error.
- Default value: Empty.
1 | export OTEL_TRACES_SAMPLER="traceidratio" |
Depending on the value of OTEL_TRACES_SAMPLER, OTEL_TRACES_SAMPLER_ARG may be set as follows:
- For traceidratio and parentbased_traceidratio samplers: Sampling probability, a number in the [0..1] range, e.g. “0.25”. Default is 1.0 if unset.
- For jaeger_remote and parentbased_jaeger_remote: The value is a comma separated list
- Example: “endpoint=http://localhost:14250,pollingIntervalMs=5000,initialSamplingRate=0.25“
OTEL_PROPAGATORS
- Specifies Propagators to be used in a comma-separated list.
- Default value: “tracecontext,baggage“
- export OTEL_PROPAGATORS=”b3”
Accepted values for OTEL_PROPAGATORS are:
| Propagator | Desc | Uri |
|---|---|---|
| tracecontext | W3C Trace Context | https://www.w3.org/TR/trace-context/ |
| baggage | W3C Baggage | https://www.w3.org/TR/baggage/ |
| b3 | B3 Single | https://github.com/openzipkin/b3-propagation#single-header |
| b3multi | B3 Multi | https://github.com/openzipkin/b3-propagation#multiple-headers |
| jaeger | Jaeger | |
| xray | AWS X-Ray | |
| ottrace | OT Trace | https://github.com/opentracing |
| none | No automatically configured propagator |
OTEL_TRACES_EXPORTER
- Specifies which exporter is used for traces. Depending on the implementation it may be a comma-separated list.
- Default value - otlp
- export OTEL_TRACES_EXPORTER=”jaeger“
Accepted values for are:
| Exporter | Desc |
|---|---|
| otlp | OTLP |
| jaeger | export in Jaeger data model |
| zipkin | Zipkin |
| console | Standard output |
| none | No automatically configured exporter for traces. |
OTEL_METRICS_EXPORTER
- Specifies which exporter is used for metrics. Depending on the implementation it may be a comma-separated list.
- Default value - otlp
- export OTEL_METRICS_EXPORTER=”prometheus“
Accepted values for OTEL_METRICS_EXPORTER are:
| Exporter | Desc |
|---|---|
| otlp | OTLP |
| prometheus | Prometheus |
| console | Standard Output |
| none | No automatically configured exporter for metrics. |
OTEL_LOGS_EXPORTER
- Specifies which exporter is used for logs. Depending on the implementation it may be a comma-separated list.
- Default value - otlp
- export OTEL_LOGS_EXPORTER=”otlp”
Accepted values for OTEL_LOGS_EXPORTER are:
| Exporter | Desc |
|---|---|
| otlp | OTLP |
| console | Standard Output |
| none | No automatically configured exporter for logs. |
OTLP Exporter
Endpoint Configuration
The following environment variables let you configure an OTLP/gRPC or OTLP/HTTP endpoint for your traces, metrics, and logs.
OTEL_EXPORTER_OTLP_ENDPOINT
- A base endpoint URL for any signal type, with an optionally-specified port number.
- Helpful for when you’re sending more than one signal to the same endpoint and want one environment variable to control the endpoint.
- Default value
- gRPC - http://localhost:4317
- export OTEL_EXPORTER_OTLP_ENDPOINT=”https://my-api-endpoint:443”
- HTTP - http://localhost:4318
- export OTEL_EXPORTER_OTLP_ENDPOINT=”http://my-api-endpoint/“
- gRPC - http://localhost:4317
- For OTLP/HTTP, exporters in the SDK construct signal-specific URLs when this environment variable is set.
- This means that if you’re sending traces, metrics, and logs, the following URLs are constructed from the example above:
- Traces - “http://my-api-endpoint**/v1/traces**”
- Metrics - “http://my-api-endpoint**/v1/metrics**”
- Logs - “http://my-api-endpoint**/v1/logs**”
OTEL_EXPORTER_OTLP_TRACES_ENDPOINT
- Endpoint URL for trace data only, with an optionally-specified port number. Typically ends with v1/traces when using OTLP/HTTP.
- Default value
- gRPC - http://localhost:4317
- export OTEL_EXPORTER_OTLP_TRACES_ENDPOINT=”https://my-api-endpoint:443”
- HTTP - http://localhost:4318/**v1/traces**
- export OTEL_EXPORTER_OTLP_TRACES_ENDPOINT=”http://my-api-endpoint/**v1/traces**”
- gRPC - http://localhost:4317
OTEL_EXPORTER_OTLP_METRICS_ENDPOINT
- Endpoint URL for metric data only, with an optionally-specified port number. Typically ends with v1/metrics when using OTLP/HTTP.
- Default value
- gRPC - http://localhost:4317
- export OTEL_EXPORTER_OTLP_METRICS_ENDPOINT=”https://my-api-endpoint:443”
- HTTP - http://localhost:4318/**v1/metrics**
- export OTEL_EXPORTER_OTLP_METRICS_ENDPOINT=”http://my-api-endpoint/**v1/metrics**”
- gRPC - http://localhost:4317
OTEL_EXPORTER_OTLP_LOGS_ENDPOINT
- Endpoint URL for log data only, with an optionally-specified port number. Typically ends with v1/logs when using OTLP/HTTP.
- Default value
- gRPC - http://localhost:4317
- export OTEL_EXPORTER_OTLP_LOGS_ENDPOINT=”https://my-api-endpoint:443”
- HTTP - http://localhost:4318/**v1/logs**
- export OTEL_EXPORTER_OTLP_LOGS_ENDPOINT=”http://my-api-endpoint/**v1/logs**”
- gRPC - http://localhost:4317
Header configuration
The following environment variables let you configure additional headers as a list of key-value pairs to add in outgoing gRPC or HTTP requests.
OTEL_EXPORTER_OTLP_HEADERS
- A list of headers to apply to all outgoing data (traces, metrics, and logs).
- Default value - N/A
- export OTEL_EXPORTER_OTLP_HEADERS=”api-key=key,other-config-value=value“
OTEL_EXPORTER_OTLP_TRACES_HEADERS
- A list of headers to apply to all outgoing traces.
- Default value - N/A
- export OTEL_EXPORTER_OTLP_TRACES_HEADERS=”api-key=key,other-config-value=value“
OTEL_EXPORTER_OTLP_METRICS_HEADERS
- A list of headers to apply to all outgoing metrics.
- Default value - N/A
- export OTEL_EXPORTER_OTLP_METRICS_HEADERS=”api-key=key,other-config-value=value“
OTEL_EXPORTER_OTLP_LOGS_HEADERS
- A list of headers to apply to all outgoing logs.
- Default value - N/A
- export OTEL_EXPORTER_OTLP_LOGS_HEADERS=”api-key=key,other-config-value=value“
Timeout Configuration
The following environment variables configure the maximum time (in milliseconds) an OTLP Exporter will wait before transmitting the net batch of data.
OTEL_EXPORTER_OTLP_TIMEOUT
- The timeout value for all outgoing data (traces, metrics, and logs) in milliseconds.
- Default value - 10000 (10s)
- export OTEL_EXPORTER_OTLP_TIMEOUT=500
OTEL_EXPORTER_OTLP_TRACES_TIMEOUT
- The timeout value for all outgoing traces in milliseconds.
- Default value - 10000 (10s)
- export OTEL_EXPORTER_OTLP_TRACES_TIMEOUT=500
OTEL_EXPORTER_OTLP_METRICS_TIMEOUT
- The timeout value for all outgoing metrics in milliseconds.
- Default value - 10000 (10s)
- export OTEL_EXPORTER_OTLP_METRICS_TIMEOUT=500
OTEL_EXPORTER_OTLP_LOGS_TIMEOUT
- The timeout value for all outgoing logs in milliseconds.
- Default value - 10000 (10s)
- export OTEL_EXPORTER_OTLP_LOGS_TIMEOUT=500
Protocol configuration
The following environment variables configure the OTLP transport protocol an OTLP exporter uses.
OTEL_EXPORTER_OTLP_PROTOCOL
- Specifies the OTLP transport protocol to be used for all telemetry data.
- Default value - SDK-dependent, but will typically be either http/protobuf or grpc.
- export OTEL_EXPORTER_OTLP_PROTOCOL=grpc
Valid values are:
| Protocol | Desc |
|---|---|
| grpc | OTLP/gRPC |
| http/protobuf | OTLP/HTTP + protobuf |
| http/json | OTLP/HTTP + JSON |
OTEL_EXPORTER_OTLP_TRACES_PROTOCOL
- Specifies the OTLP transport protocol to be used for trace data.
- Default value - SDK-dependent, but will typically be either http/protobuf or grpc.
- export OTEL_EXPORTER_OTLP_TRACES_PROTOCOL=grpc
Valid values are:
| Protocol | Desc |
|---|---|
| grpc | OTLP/gRPC |
| http/protobuf | OTLP/HTTP + protobuf |
| http/json | OTLP/HTTP + JSON |
OTEL_EXPORTER_OTLP_METRICS_PROTOCOL
- Specifies the OTLP transport protocol to be used for metrics data.
- Default value - SDK-dependent, but will typically be either http/protobuf or grpc.
- export OTEL_EXPORTER_OTLP_METRICS_PROTOCOL=grpc
Valid values are:
| Protocol | Desc |
|---|---|
| grpc | OTLP/gRPC |
| http/protobuf | OTLP/HTTP + protobuf |
| http/json | OTLP/HTTP + JSON |
OTEL_EXPORTER_OTLP_LOGS_PROTOCOL
- Specifies the OTLP transport protocol to be used for log data.
- Default value - SDK-dependent, but will typically be either http/protobuf or grpc.
- export OTEL_EXPORTER_OTLP_LOGS_PROTOCOL=grpc
Valid values are:
| Protocol | Desc |
|---|---|
| grpc | OTLP/gRPC |
| http/protobuf | OTLP/HTTP + protobuf |
| http/json | OTLP/HTTP + JSON |
Go
TBD
JavaScript
TBD
Python
TBD
Java
- This is the OpenTelemetry Java documentation.
- OpenTelemetry is an observability framework
- an API, SDK, and tools that are designed to aid in the generation and collection of application telemetry data such as metrics, logs, and traces.
TBD
Platforms and environments
TBD
Zero-code Instrumentation
TBD
Collector
Vendor-agnostic way to receive, process and export telemetry data.

Introduction
- The OpenTelemetry Collector offers a vendor-agnostic implementation of how to receive, process and export telemetry data.
- It removes the need to run, operate, and maintain multiple agents/collectors.
- This works with improved scalability and supports open source observability data formats (e.g. Jaeger, Prometheus, Fluent Bit, etc.)
- sending to one or more open source or commercial backends.
- The local Collector agent is the default location to which instrumentation libraries export their telemetry data.
Objectives
| Objectives | Desc |
|---|---|
| Usability | Reasonable default configuration, supports popular protocols, runs and collects out of the box. |
| Performance | Highly stable and performant under varying loads and configurations. |
| Observability | An exemplar of an observable service. |
| Extensibility | Customizable without touching the core code. |
| Unification | Single codebase, deployable as an agent or collector with support for traces, metrics, and logs. |
When to use a collector
- For most language specific instrumentation libraries you have exporters for popular backends and OTLP. You might wonder,
- under what circumstances does one use a collector to send data, as opposed to having each service send directly to the backend?
- For trying out and getting started with OpenTelemetry, sending your data directly to a backend is a great way to get value quickly.
- Also, in a development or small-scale environment you can get decent results without a collector.
- However, in general we recommend using a collector alongside your service
- since it allows your service to offload data quickly
- and the collector can take care of additional handling like retries, batching, encryption or even sensitive data filtering.
- It is also easier to setup a collector than you might think
- the default OTLP exporters in each language assume a local collector endpoint
- so if you launch a collector it will automatically start receiving telemetry.
Status and releases
- The Collector status is: mixed, since core Collector components currently have mixed stability levels.
- Collector components differ in their maturity levels. Each component has its stability documented in its README.md.
Quick start
Setup and collect telemetry in minutes!
- The OpenTelemetry Collector receives traces, metrics, and logs
- processes the telemetry, and exports it to a wide variety of observability backends using its components.
- You are going to learn to do the following in less than five minutes:
- Set up and run the OpenTelemetry Collector.
- Send telemetry and see it processed by the Collector.
Prerequisites
- Make sure that your developer environment has the following.
- This page assumes that you’re using bash. Adapt configuration and commands as necessary for your preferred shell.
- Docker or any compatible containers’ runtime.
- Go 1.20 or higher
- GOBIN environment variable is set; if unset, initialize it appropriately
Set up the environment
Pull in the OpenTelemetry Collector Contrib Docker image:
1 | docker pull otel/opentelemetry-collector-contrib:0.119.0 |
Install the telemetrygen utility - This utility can simulate a client generating traces, metrics, and logs.
1 | go install github.com/open-telemetry/opentelemetry-collector-contrib/cmd/telemetrygen@latest |
Generate and collect telemetry
Launch the Collector, listening on ports 4317 (for OTLP gRPC), 4318 (for OTLP HTTP) and 55679 (for ZPages):
1 | docker run \ |
In a separate terminal window, generate a few sample traces:
1 | $GOBIN/telemetrygen traces --otlp-insecure --traces 3 |
Among the output generated by the utility, you should see a confirmation that traces were generated:
1 | 2025-02-12T11:15:47.253+0800 INFO traces/worker.go:112 traces generated {"worker": 0, "traces": 3} |
For an easier time seeing relevant output you can filter it:
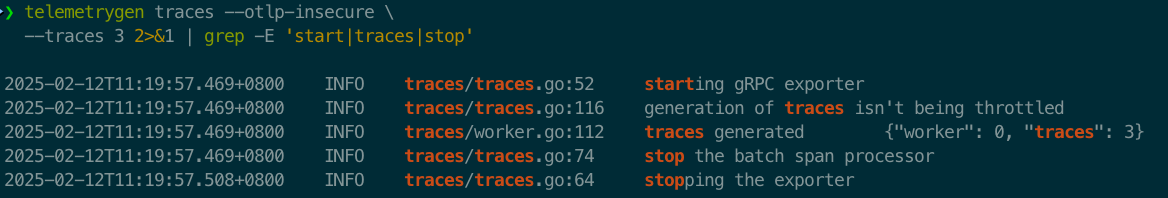
In the terminal window running the Collector container, you should see trace ingest activity similar to what is shown in the following example:
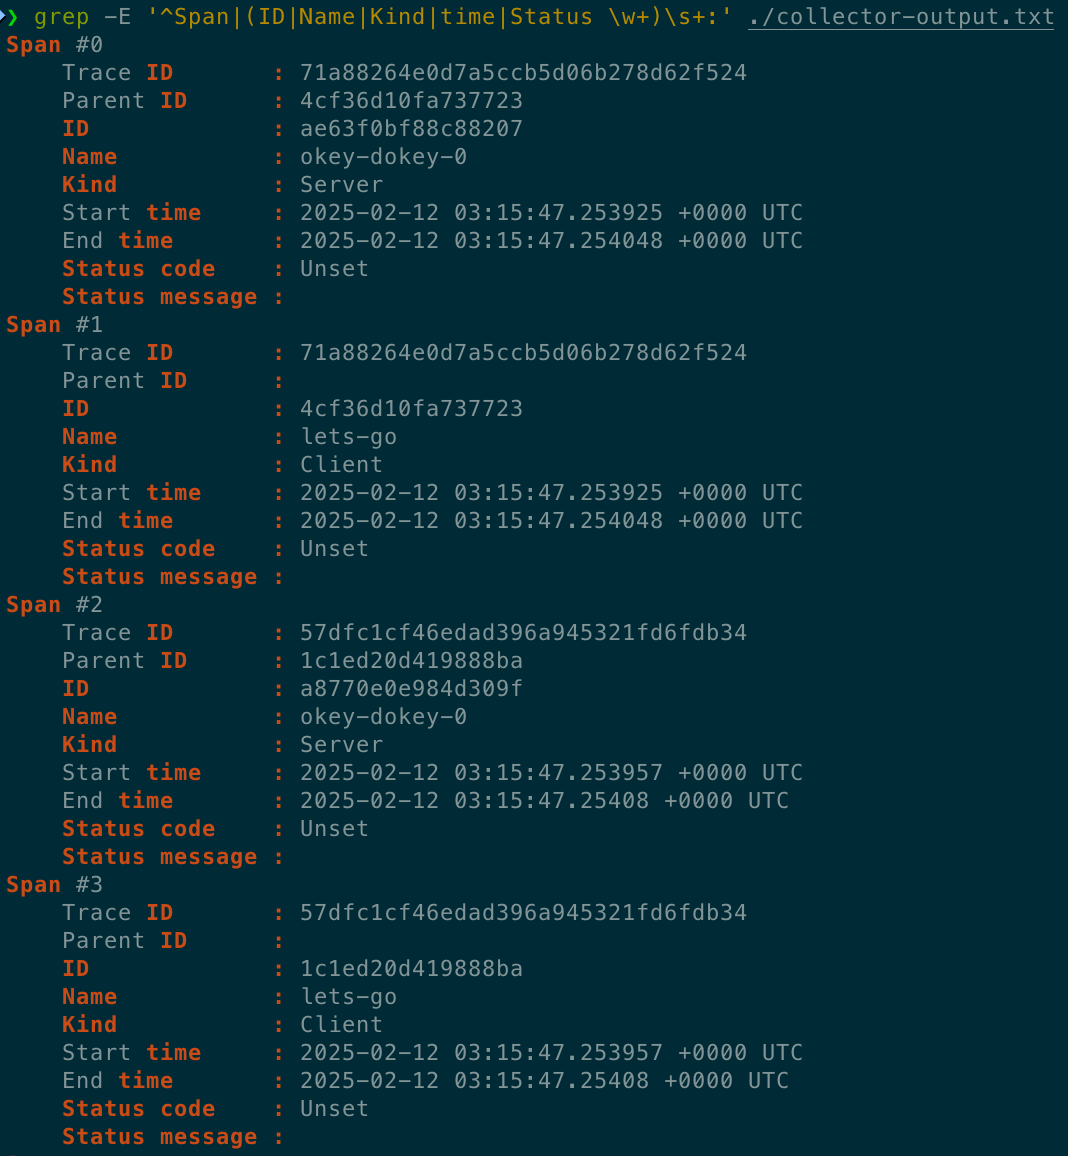
Open http://localhost:55679/debug/tracez and select one of the samples in the table to see the traces you’ve just generated.
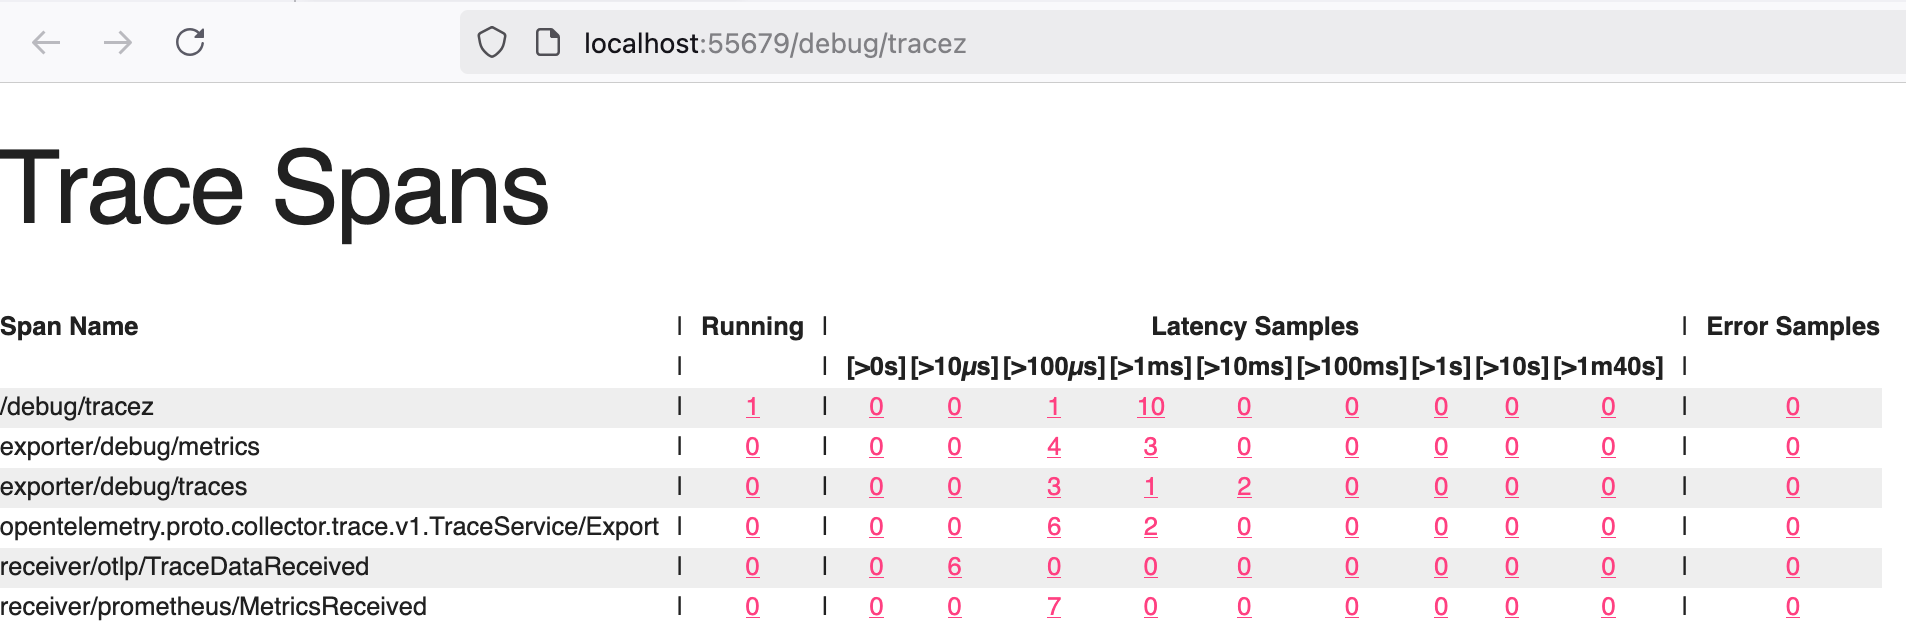
Next steps
In this tutorial you’ve started the OpenTelemetry Collector and sent telemetry to it. As next steps, consider doing the following:
- Explore different ways to install the Collector.
- Learn about the different modes of the Collector in Deployment Methods.
- Familiarize yourself with the Collector configuration files and structure.
- Explore available components in the registry.
- Learn how to build a custom Collector with the OpenTelemetry Collector Builder (OCB).
Install the Collector
- You can deploy the OpenTelemetry Collector on a wide variety of operating systems and architectures.
- The following instructions show how to download and install the latest stable version of the Collector.
Docker
The following commands pull a Docker image and run the Collector in a container.
1 | docker pull otel/opentelemetry-collector-contrib:0.119.0 |
To load a custom configuration file from your working directory, mount that file as a volume:
1 | docker run -v $(pwd)/config.yaml:/etc/otelcol-contrib/config.yaml otel/opentelemetry-collector-contrib:0.119.0 |
Docker Compose
You can add OpenTelemetry Collector to your existing docker-compose.yaml file as in the following example:
1 | otel-collector: |
Kubernetes
The following command deploys an agent as a daemonset and a single gateway instance:
1 | kubectl apply -f https://raw.githubusercontent.com/open-telemetry/opentelemetry-collector/v0.119.0/examples/k8s/otel-config.yaml |
- The previous example is meant to serve as a starting point, to be extended and customized before actual production usage.
- For production-ready customization and installation, see OpenTelemetry Helm Charts.
- You can also use the OpenTelemetry Operator to provision and maintain an OpenTelemetry Collector instance, with features such as
- automatic upgrade handling
- Service configuration based on the OpenTelemetry configuration
- automatic sidecar injection into deployments, and more.
Deployment
Patterns you can apply to deploy the OpenTelemetry collector
- The OpenTelemetry Collector consists of a single binary which you can use in different ways, for different use cases.
- This section describes deployment patterns
- their use cases along with pros and cons and best practices for collector configurations for cross-environment and multi-backend deployments.
| Patterns | Desc |
|---|---|
| No Collector | send signals directly from app to backends |
| Agent | send signals to collectors and from there to backends |
| Gateway | send signals to a single OTLP end-point and from there to backends |
No Collector
Why and how to send signals directly from app to backends
- The simplest pattern is not to use a collector at all.
- This pattern consists of applications instrumented with an OpenTelemetry SDK that export telemetry signals directly into a backend

Tradeoffs
- Pros
- Simple to use (especially in a dev/test environment)
- No additional moving parts to operate (in production environments)
- Cons
- Requires code changes if collection, processing, or ingestion changes
- Strong coupling between the application code and the backend
- There are limited number of exporters per language implementation
Agent
Why and how to send signals to collectors and from there to backends - such as a sidecar or a daemonset
The agent collector deployment pattern consists of
applications – instrumented with an OpenTelemetry SDK using OpenTelemetry protocol (OTLP)
or other collectors (using the OTLP exporter)
- that send telemetry signals to a collector instance running with the application
- or on the same host as the application (such as a sidecar or a daemonset).
Each client-side SDK or downstream collector is configured with a collector location:
- In the app, the SDK is configured to send OTLP data to a collector.
- The collector is configured to send telemetry data to one or more backends.

Example
- A concrete example of the agent collector deployment pattern could look as follows:
- You manually instrument, say, a Java application to export metrics using the OpenTelemetry Java SDK.
- In the context of the app, you would set the OTEL_METRICS_EXPORTER to otlp (which is the default value)
- and configure the OTLP exporter with the address of your collector, for example (in Bash or zsh shell)
1 | export OTEL_EXPORTER_OTLP_ENDPOINT=http://collector.example.com:4318 |
The collector serving at collector.example.com:4318 would then be configured like so:
Traces
Jaeger
1 | receivers: |
Metrics
Prometheus
1 | receivers: |
Logs
Elasticsearch
1 | receivers: |
Tradeoffs
- Pros
- Simple to get started
- Clear 1:1 mapping between application and collector
- Cons
- Scalability - human and load-wise
- Inflexible
Gateway
Why and how to send signals to a single OTLP end-point and from there to backends
- The gateway collector deployment pattern consists of applications (or other collectors) sending telemetry signals
- to a single OTLP endpoint provided by one or more collector instances running as a standalone service
- for example, a deployment in Kubernetes
- typically per cluster, per data center or per region.
- to a single OTLP endpoint provided by one or more collector instances running as a standalone service
- In the general case you can use an out-of-the-box load balancer to distribute the load amongst the collectors:

- For use cases where the processing of the telemetry data processing has to happen in a specific collector
- you would use a two-tiered setup with a collector
- that has a pipeline configured with the Trace ID/Service-name aware load-balancing exporter in the first tier
- and the collectors handling the scale out in the second tier.
- For example, you will need to use the load-balancing exporter when using the Tail Sampling processor
- so that all spans for a given trace reach the same collector instance where the tail sampling policy is applied.
- Let’s have a look at such a case where we are using the load-balancing exporter:
- In the app, the SDK is configured to send OTLP data to a central location.
- A collector configured using the load-balancing exporter that distributes signals to a group of collectors.
- The collectors are configured to send telemetry data to one or more backends.

Examples
Nginx
NGINX as an “out-of-the-box” load balancer
- Assuming you have three collectors configured - collector1 + collector2 + collector3
- and you want to load balance traffic across them using NGINX, you can use the following configuration
1 | server { |
load-balancing exporter
- For a concrete example of the centralized collector deployment pattern we first need to have a closer look at the load-balancing exporter.
- The resolver, which determines where to find the downstream collectors (or: backends).
- If you use the static sub-key here, you will have to manually enumerate the collector URLs.
- The other supported resolver is the DNS resolver which will periodically check for updates and resolve IP addresses.
- For this resolver type, the hostname sub-key specifies the hostname to query in order to obtain the list of IP addresses.
- With the routing_key field you tell the load-balancing exporter to route spans to specific downstream collectors.
- If you set this field to traceID (default) then the Load-balancing exporter exports spans based on their traceID.
- Otherwise, if you use service as the value for routing_key
- it exports spans based on their service name which is useful when using connectors like the Span Metrics connector
- so all spans of a service will be send to the same downstream collector for metric collection, guaranteeing accurate aggregations.
- The load-balancing exporter emits metrics including otelcol_loadbalancer_num_backends and otelcol_loadbalancer_backend_latency
- that you can use for health and performance monitoring of the OTLP endpoint collector.
The first-tier collector servicing the OTLP endpoint would be configured as shown below:
Static
1 | receivers: |
DNS
1 | receivers: |
DNS with service
routing_key: service
1 | receivers: |
Combined deployment
Combined deployment of Collectors as agents and gateways
- Often a deployment of multiple OpenTelemetry collectors involves running both Collector as gateways and as agents.
- The following diagram shows an architecture for such a combined deployment:
- We use the Collectors running in the agent deployment pattern (running on each host, similar to Kubernetes daemonsets)
- to collect telemetry from services running on the host and host telemetry, such as host metrics and scrap logs.
- We use Collectors running in the gateway deployment pattern to process data, such as filtering, sampling, and exporting to backends etc.
- We use the Collectors running in the agent deployment pattern (running on each host, similar to Kubernetes daemonsets)

- This combined deployment pattern is necessary
- when you use components in your Collector that either need to be unique per host
- or that consume information that is only available on the same host as the application is running:
- Receivers like the hostmetricsreceiver or filelogreceiver need to be unique per host instance.
- Running multiple instances of these receivers will result in duplicated data.
- Processors like the resourcedetectionprocessor are used to add information about the host, the collector and the application are running on.
- Running them within a Collector on a remote machine will result in incorrect data.
Tradeoffs
- Pros
- Separation of concerns such as centrally managed credentials
- Centralized policy management (for example, filtering certain logs or sampling)
- Cons
- It’s one more thing to maintain and that can fail (complexity)
- Added latency in case of cascaded collectors
- Higher overall resource usage (costs)
Single-writer principle
Multiple collectors and the single-writer principle
- All metric data streams within OTLP must have a single writer.
- When deploying multiple collectors in a gateway configuration
- it’s important to ensure that all metric data streams have a single writer and a globally unique identity.
Potential problems
- Concurrent access from multiple applications that modify or report on the same data can lead to data loss or degraded data quality.
- For example, you might see inconsistent data from multiple sources on the same resource
- where the different sources can overwrite each other because the resource is not uniquely identified.
- There are patterns in the data that may provide some insight into whether this is happening or not.
- a series with unexplained gaps or jumps in the same series may be a clue that multiple collectors are sending the same samples.
- You might also see errors in your backend.
- For example, with a Prometheus backend: Error on ingesting out-of-order samples
- This error could indicate that identical targets exist in two jobs, and the order of the timestamps is incorrect.
1 | Metric M1 received at T1 with a timestamp 13:56:04 with value 100 |
Best practices
- Use the Kubernetes attributes processor to add labels to different Kubernetes resources.
- Use the resource detector processor to detect resource information from the host and collect resource metadata.
Configuration
You can configure the OpenTelemetry Collector to suit your observability needs.
Location
- By default, the Collector configuration is located in
/etc/<otel-directory>/config.yaml - where
<otel-directory>can be otelcol, otelcol-contrib, or another value - depending on the Collector version or the Collector distribution you’re using.
You can provide one or more configurations using the –config option. For example:
1 | otelcol --config=customconfig.yaml |
You can also provide configurations using environment variables, HTTP URIs, or YAML paths. For example:
1 | otelcol --config=env:MY_CONFIG_IN_AN_ENVVAR --config=https://server/config.yaml |
When referring to nested keys in YAML paths, make sure to use double colons (::) to avoid confusion with namespaces that contain dots.
1 | receivers::docker_stats::metrics::container.cpu.utilization::enabled: false |
To validate a configuration file, use the validate command. For example:
1 | otelcol validate --config=customconfig.yaml |
Configuration structure
- The structure of any Collector configuration file consists of four classes of pipeline components that access telemetry data:
- Receivers + Processors + Exporters + Connectors
- After each pipeline component is configured you must enable it using the pipelines within the service section of the configuration file.
- Besides pipeline components you can also configure extensions
- which provide capabilities that can be added to the Collector, such as diagnostic tools.
- Extensions don’t require direct access to telemetry data and are enabled through the service section.
- The following is an example of Collector configuration with a receiver, a processor, an exporter, and three extensions.
- While it is generally preferable to bind endpoints to localhost when all clients are local
- our example configurations use the “unspecified” address 0.0.0.0 as a convenience.
- The Collector currently defaults to 0.0.0.0, but the default will be changed to localhost in the near future.
- While it is generally preferable to bind endpoints to localhost when all clients are local
1 | receivers: |
- Note that receivers, processors, exporters and pipelines are defined through component identifiers following the type[/name] format
- for example otlp or otlp/2.
- You can define components of a given type more than once as long as the identifiers are unique. For example:
1 | receivers: |
The configuration can also include other files, causing the Collector to merge them in a single in-memory representation of the YAML configuration:
1 | receivers: |
The final result in memory will be:
1 | receivers: |
Receivers
- Receivers collect telemetry from one or more sources. They can be pull or push based, and may support one or more data sources (signals).
- Receivers are configured in the receivers section.
- Many receivers come with default settings, so that specifying the name of the receiver is enough to configure it.
- If you need to configure a receiver or want to change the default configuration, you can do so in this section.
- Any setting you specify overrides the default values, if present.
- Configuring a receiver does not enable it.
- Receivers are enabled by adding them to the appropriate pipelines within the service section.
- The Collector requires one or more receivers. The following example shows various receivers in the same configuration file:
1 | receivers: |
Processors
- Processors take the data collected by receivers and modify or transform it before sending it to the exporters.
- Data processing happens according to rules or settings defined for each processor
- which might include filtering, dropping, renaming, or recalculating telemetry, among other operations.
- The order of the processors in a pipeline determines the order of the processing operations that the Collector applies to the signal.
- Processors are optional, although some are recommended
- You can configure processors using the processors section of the Collector configuration file.
- Any setting you specify overrides the default values, if present.
- Configuring a processor does not enable it.
- Processors are enabled by adding them to the appropriate pipelines within the service section.
- The following example shows several default processors in the same configuration file.
- You can find the full list of processors by combining the list from opentelemetry-collector-contrib and the list from opentelemetry-collector.
1 | processors: |
Exporters
- Exporters send data to one or more backends or destinations.
- Exporters can be pull or push based, and may support one or more data sources - signals.
- Each key within the exporters section defines an exporter instance,The key follows the type/name format
- where type specifies the exporter type (e.g., otlp, kafka, prometheus)
- and name (optional) can be appended to provide a unique name for multiple instance of the same type.
- Most exporters require configuration to specify at least the destination, as well as security settings,like authentication tokens or TLS certificates.
- Any setting you specify overrides the default values, if present.
- Configuring an exporter does not enable it.
- Exporters are enabled by adding them to the appropriate pipelines within the service section.
- Notice that some exporters require x.509 certificates in order to establish secure connections, as described in setting up certificates.
- The Collector requires one or more exporters. The following example shows various exporters in the same configuration file:
otlphttp
1 | exporters: |
Connectors
- Connectors join two pipelines, acting as both exporter and receiver.
- A connector consumes data as an exporter at the end of one pipeline and emits data as a receiver at the beginning of another pipeline.
- The data consumed and emitted may be of the same type or of different data types.
- You can use connectors to summarize consumed data, replicate it, or route it.
- You can configure one or more connectors using the connectors section of the Collector configuration file.
- By default, no connectors are configured.
- Each type of connector is designed to work with one or more pairs of data types and may only be used to connect pipelines accordingly.
- Configuring a connector doesn’t enable it.
- Connectors are enabled through pipelines within the service section.
- The following example shows the count connector and how it’s configured in the pipelines section.
- Notice that the connector acts as an exporter for traces and as a receiver for metrics, connecting both pipelines:
1 | receivers: |
Extensions
- Extensions are optional components
- that expand the capabilities of the Collector to accomplish tasks not directly involved with processing telemetry data.
- For example, you can add extensions for Collector health monitoring, service discovery, or data forwarding, among others.
- You can configure extensions through the extensions section of the Collector configuration file.
- Most extensions come with default settings, so you can configure them just by specifying the name of the extension.
- Any setting you specify overrides the default values, if present.
- Configuring an extension doesn’t enable it. Extensions are enabled within the service section.
- By default, no extensions are configured. The following example shows several extensions configured in the same file:
1 | extensions: |
Service
- The service section is used to configure what components are enabled in the Collector based on
- the configuration found in the receivers, processors, exporters, and extensions sections.
- If a component is configured, but not defined within the service section, then it’s not enabled.
- The service section consists of three subsections - Extensions + Pipelines + Telemetry
Extensions
The extensions subsection consists of a list of desired extensions to be enabled. For example:
1 | service: |
Pipelines
- The pipelines subsection is where the pipelines are configured, which can be of the following types:
- traces - collect and processes trace data.
- metrics - collect and processes metric data.
- logs - collect and processes log data.
- A pipeline consists of a set of receivers, processors and exporters.
- Before including a receiver, processor, or exporter in a pipeline, make sure to define its configuration in the appropriate section.
- You can use the same receiver, processor, or exporter in more than one pipeline.
- When a processor is referenced in multiple pipelines, each pipeline gets a separate instance of the processor.
- The following is an example of pipeline configuration. Note that the order of processors dictates the order in which data is processed:
1 | service: |
Telemetry
- The telemetry config section is where you can set up observability for the Collector itself.
- It consists of two subsections: logs and metrics.
Other Information
Environment variables
- The use and expansion of environment variables is supported in the Collector configuration.
- For example to use the values stored on the DB_KEY and OPERATION environment variables you can write the following:
1 | processors: |
Use $$ to indicate a literal $. - For example, representing $DataVisualization would look like the following
1 | exporters: |
Proxy support
- Exporters that use the net/http package respect the following proxy environment variables
- HTTP_PROXY - Address of the HTTP proxy
- HTTPS_PROXY - Address of the HTTPS proxy
- NO_PROXY - Addresses that must not use the proxy
- If set at Collector start time, exporters, regardless of the protocol, proxy traffic or bypass proxy traffic as defined by these environment variables.
Authentication
- Most receivers exposing an HTTP or gRPC port can be protected using the Collector’s authentication mechanism.
- Similarly, most exporters using HTTP or gRPC clients can add authentication to outgoing requests.
- The authentication mechanism in the Collector uses the extensions mechanism
- allowing for custom authenticators to be plugged into Collector distributions.
- Each authentication extension has two possible usages
- As client authenticator for exporters, adding auth data to outgoing requests
- As server authenticator for receivers, authenticating incoming connections.
- To add a server authenticator to a receiver in the Collector, follow these steps:
- Add the authenticator extension and its configuration under .extensions.
- Add a reference to the authenticator to .services.extensions, so that it’s loaded by the Collector.
- Add a reference to the authenticator under
.receivers.<your-receiver>.<http-or-grpc-config>.auth
- The following example uses the OIDC authenticator on the receiver side
- making this suitable for a remote Collector that receives data from an OpenTelemetry Collector acting as agent:
1 | extensions: |
On the agent side, this is an example that makes the OTLP exporter obtain OIDC tokens, adding them to every RPC made to a remote Collector:
1 | extensions: |
Configuring certificates
- In a production environment, use TLS certificates for secure communication or mTLS for mutual authentication.
- Follow these steps to generate self-signed certificates as in this example.
- You might want to use your current cert provisioning procedures to procure a certificate for production usage.
Install cfssl and create the following csr.json file:
1 | { |
Then run the following commands:
1 | cfssl genkey -initca csr.json | cfssljson -bare ca |
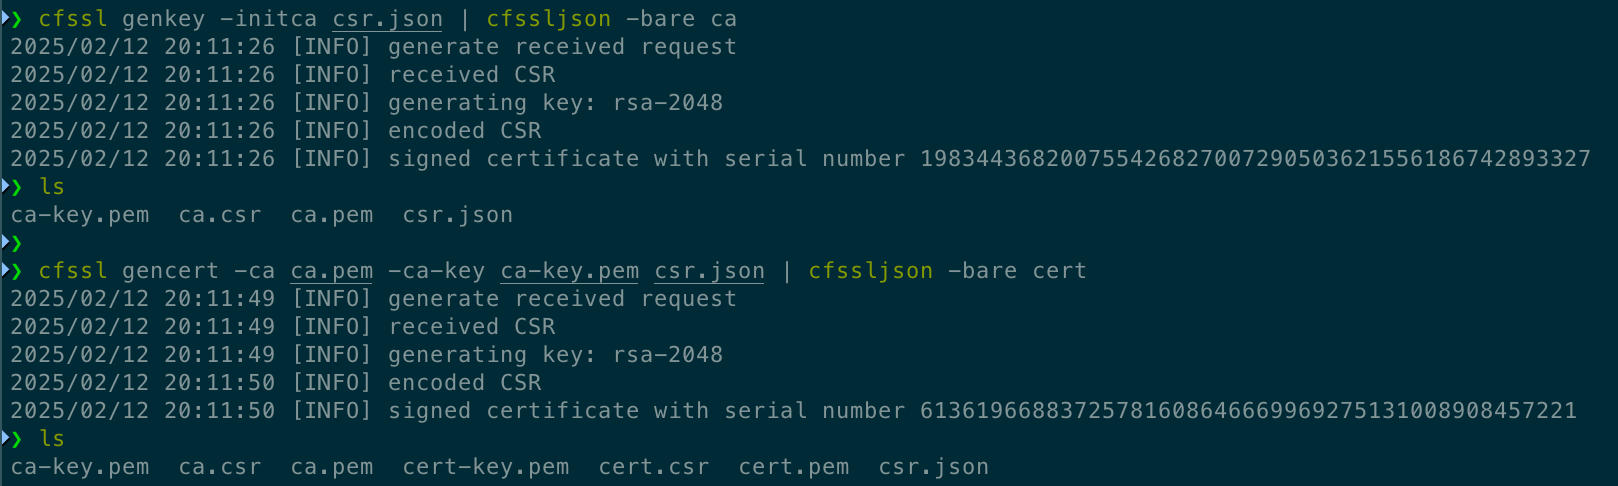
This creates two certificates:
- An “OpenTelemetry Example” Certificate Authority (CA) in ca.pem, with the associated key in ca-key.pem
- A client certificate in cert.pem, signed by the OpenTelemetry Example CA, with the associated key in cert-key.pem.
Override settings
The –set option doesn’t support setting a key that contains a dot or an equal sign.
- You can override Collector settings using the –set option.
- The settings you define with this method are merged into the final configuration after all –config sources are resolved and merged.
- The following examples show how to override settings inside nested sections:
1 | otelcol --set "exporters::debug::verbosity=detailed" |
Management
How to manage your OpenTelemetry collector deployment at scale
Basics
Telemetry collection at scale requires a structured approach to manage agents. Typical agent management tasks include:
- Querying the agent information and configuration.
- The agent information can include its version, operating system related information, or capabilities.
- The configuration of the agent refers to its telemetry collection setup, for example, the OpenTelemetry Collector configuration.
- Upgrading/downgrading agents and management of agent-specific packages, including the base agent functionality and plugins.
- Applying new configurations to agents. This might be required because of changes in the environment or due to policy changes.
- Health and performance monitoring of the agents
- typically CPU and memory usage and also agent-specific metrics, for example, the rate of processing or backpressure-related information.
- Connection management between a control plane and the agent such as handling of TLS certificates (revocation and rotation).
Not every use case requires support for all of the above agent management tasks.
In the context of OpenTelemetry task 4. Health and performance monitoring is ideally done using OpenTelemetry.
OpAMP
- Observability vendors and cloud providers offer proprietary solutions for agent management.
- In the open source observability space, there is an emerging standard that you can use for agent management
- Open Agent Management Protocol (OpAMP).
- The OpAMP specification defines how to manage a fleet of telemetry data agents.
- These agents can be OpenTelemetry Collectors, Fluent Bit or other agents in any arbitrary combination.
- The term “agent” is used here as a catch-all term for OpenTelemetry components that respond to OpAMP
- this could be the collector but also SDK components.
- OpAMP is a client/server protocol that supports communication over HTTP and over WebSockets:
- The OpAMP server is part of the control plane and acts as the orchestrator, managing a fleet of telemetry agents.
- The OpAMP client is part of the data plane.
- The client side of OpAMP can be implemented in-process, for example, as the case in OpAMP support in the OpenTelemetry Collector.
- For this latter option, you can use a supervisor that takes care of the OpAMP specific communication with the OpAMP server
- and at the same time controls the telemetry agent, for example to apply a configuration or to upgrade it.
- Note that the supervisor/telemetry communication is not part of OpAMP.
Let’s have a look at a concrete setup:

- The OpenTelemetry Collector, configured with pipeline(s) to
- (A) receive signals from downstream sources
- (B) export signals to upstream destinations
- potentially including telemetry about the collector itself
- represented by the OpAMP own_xxx connection settings
- The bi-directional OpAMP control flow between the control plane implementing the server-side OpAMP part
- and the collector (or a supervisor controlling the collector) implementing OpAMP client-side.
- You can try out a simple OpAMP setup yourself by using the OpAMP protocol implementation in Go.
- For the following walkthrough you will need to have Go in version 1.19 or above available.
- We will set up a simple OpAMP control plane consisting of an example OpAMP server
- and let an OpenTelemetry Collector connect to it via an example OpAMP supervisor.
First, clone the open-telemetry/opamp-go repository:
1 | git clone https://github.com/open-telemetry/opamp-go.git |
- Next, we need an OpenTelemetry Collector binary that the OpAMP supervisor can manage.
- For that, install the OpenTelemetry Collector Contrib distro.
- The path to the collector binary (where you installed it into) is referred to as $OTEL_COLLECTOR_BINARY in the following.
- In the ./opamp-go/internal/examples/server directory, launch the OpAMP server:
1 | $ go run . |
In the ./opamp-go/internal/examples/supervisor directory create a file named supervisor.yaml with the following content
telling the supervisor where to find the server and what OpenTelemetry Collector binary to manage
1 | server: |
Next, create a collector configuration as follows
save it in a file called effective.yaml in the ./opamp-go/internal/examples/supervisor directory)
1 | receivers: |
Now it’s time to launch the supervisor (which in turn will launch your OpenTelemetry Collector):
1 | $ go run . |
If everything worked out you should now be able to go to http://localhost:4321/
and access the OpAMP server UI where you should see your collector listed, managed by the supervisor:
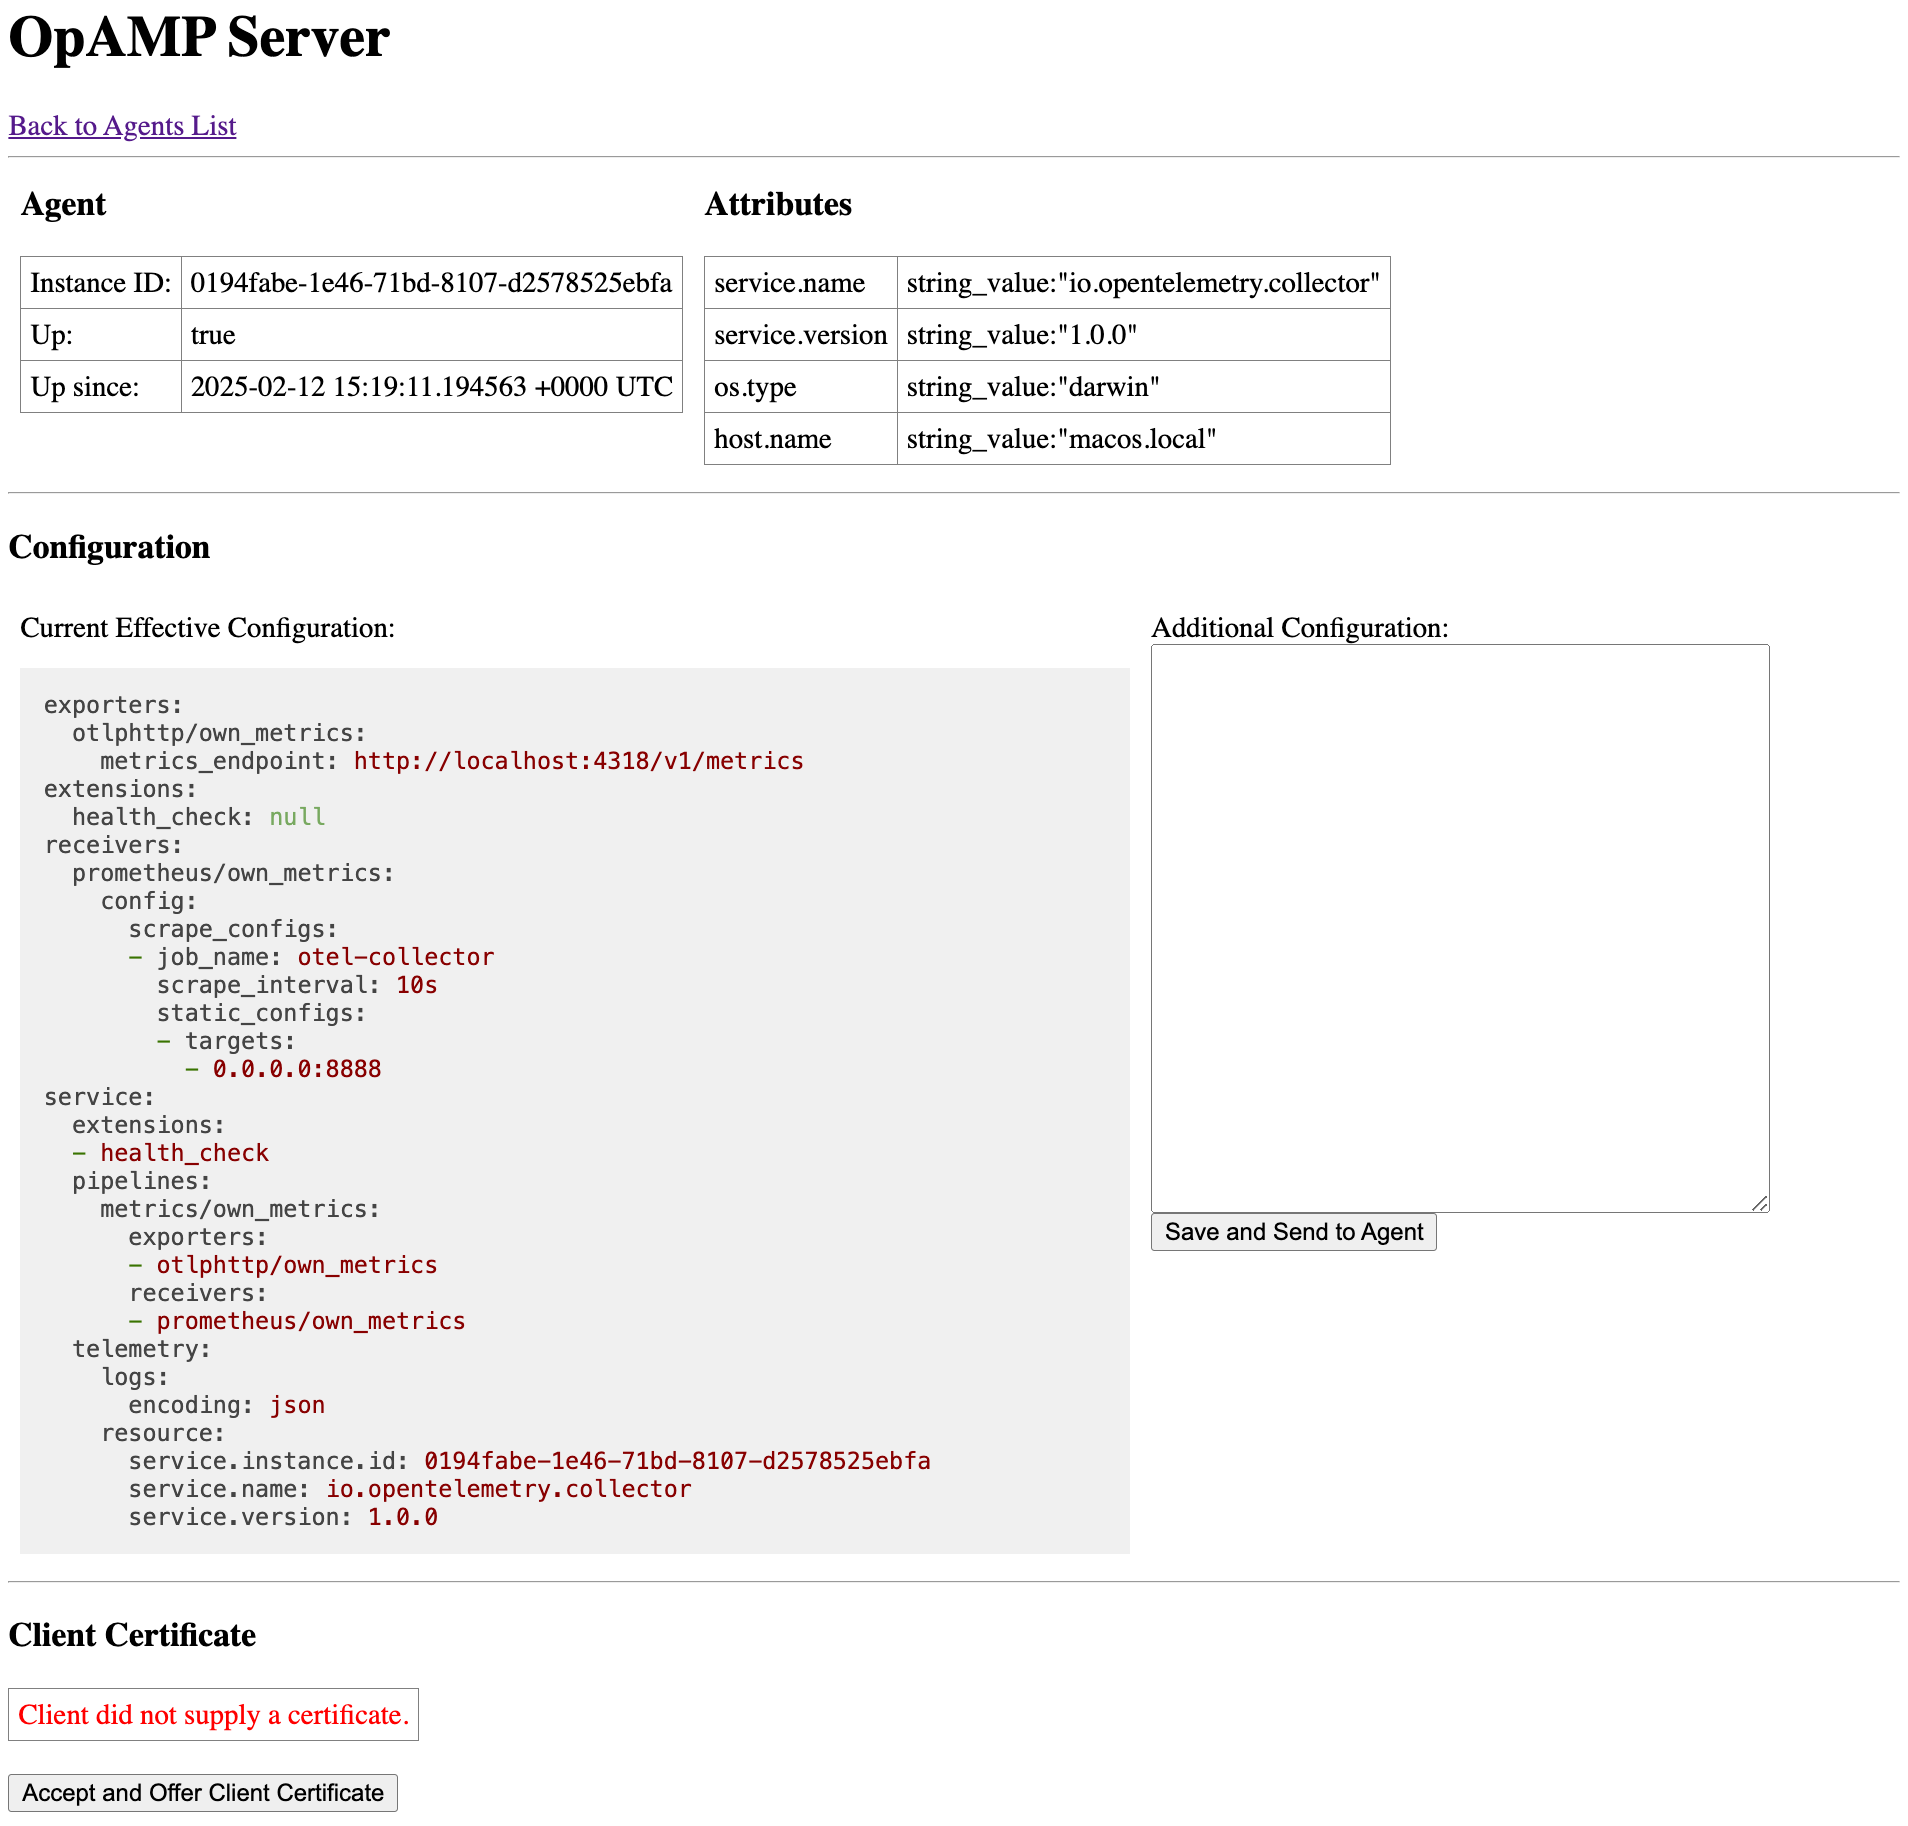
You can also query the collector for the metrics exported (note the label values):
1 | $ curl localhost:8888/metrics |
Distributions
- The OpenTelemetry project currently offers pre-built distributions of the collector.
- The components included in the distributions can be found by in the manifest.yaml of each distribution.
Distributions
- otelcol
- This distribution contains all the components from the OpenTelemetry Collector repository
- and a small selection of components tied to open source projects from the OpenTelemetry Collector Contrib repository.
- This distribution is considered “classic“ and is no longer accepting new components outside of components from the Core repo.
- otelcol-contrib
- This distribution contains all the components from
- both the OpenTelemetry Collector repository and the OpenTelemetry Collector Contrib repository.
- This distribution includes open source and vendor supported components.
- This distribution contains all the components from
- otelcol-k8s
- This distribution is made specifically to be used in a Kubernetes cluster to monitor Kubernetes and services running in Kubernetes.
- It contains a subset of components from OpenTelemetry Collector Core and OpenTelemetry Collector Contrib.
- otelcol-otlp
- This distribution only contains the receiver and exporters for the OpenTelemetry Protocol (OTLP), including both gRPC and HTTP transport.
Custom Distributions
- For various reasons the existing distributions provided by the OpenTelemetry project may not meet your needs.
- Whether you want a smaller version
- or have the need to implement custom functionality like authenticator extensions, receivers, processors, exporters or connectors.
- The tool used to build distributions ocb (OpenTelemetry Collector Builder) is available to build your own distributions.
Internal telemetry
- You can inspect the health of any OpenTelemetry Collector instance by checking its own internal telemetry.
- Read on to learn about this telemetry and how to configure it to help you monitor and troubleshoot the Collector.
- The Collector uses the OpenTelemetry SDK declarative configuration schema for configuring how to export its internal telemetry.
- This schema is still under development and may undergo breaking changes in future releases.
- We intend to keep supporting older schemas until a 1.0 schema release is available
- and offer a transition period for users to update their configurations before dropping pre-1.0 schemas.
Activate internal telemetry in the Collector
By default, the Collector exposes its own telemetry in two ways:
- Internal metrics are exposed using a Prometheus interface which defaults to port 8888
- Logs are emitted to stderr by default.
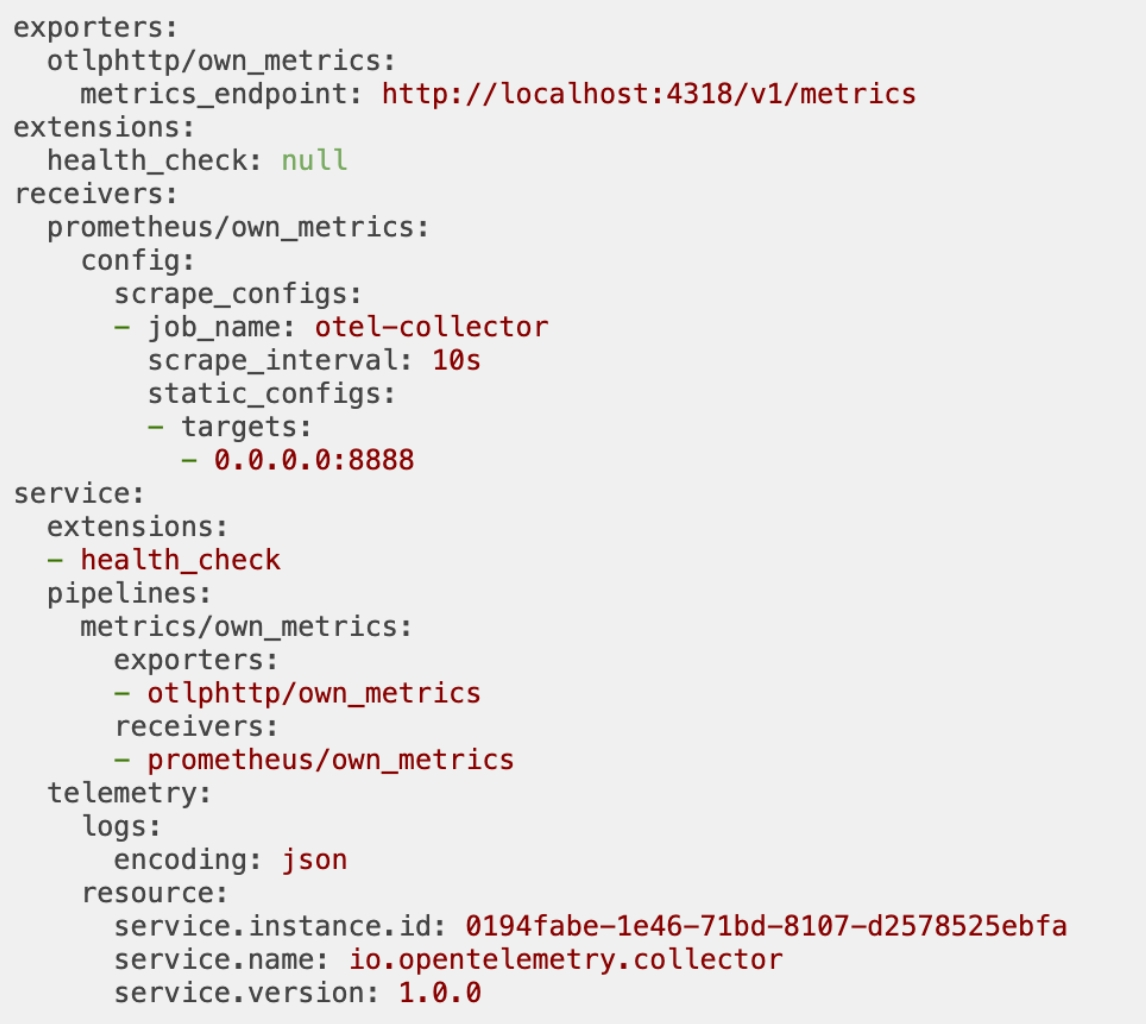
Configure internal metrics
- You can configure how internal metrics are generated and exposed by the Collector.
- By default, the Collector generates basic metrics about itself and exposes them
- using the OpenTelemetry Go Prometheus exporter for scraping at http://127.0.0.1:8888/metrics.
The Collector can push its internal metrics to an OTLP backend via the following configuration:
1 | service: |
Alternatively, you can expose the Prometheus endpoint to one specific or all network interfaces when needed.
For containerized environments, you might want to expose this port on a public interface.
Set the Prometheus config under service::telemetry::metrics:
1 | service: |
You can adjust the verbosity of the Collector metrics output by setting the level field to one of the following values:
| Verbosity | Desc |
|---|---|
| none | no telemetry is collected. |
| basic | essential service telemetry. |
| normal | the default level, adds standard indicators on top of basic. |
| detailed | the most verbose level, includes dimensions and views. |
Each verbosity level represents a threshold at which certain metrics are emitted
The default level for metrics output is normal. To use another level, set service::telemetry::metrics::level:
1 | service: |
OpAMP server
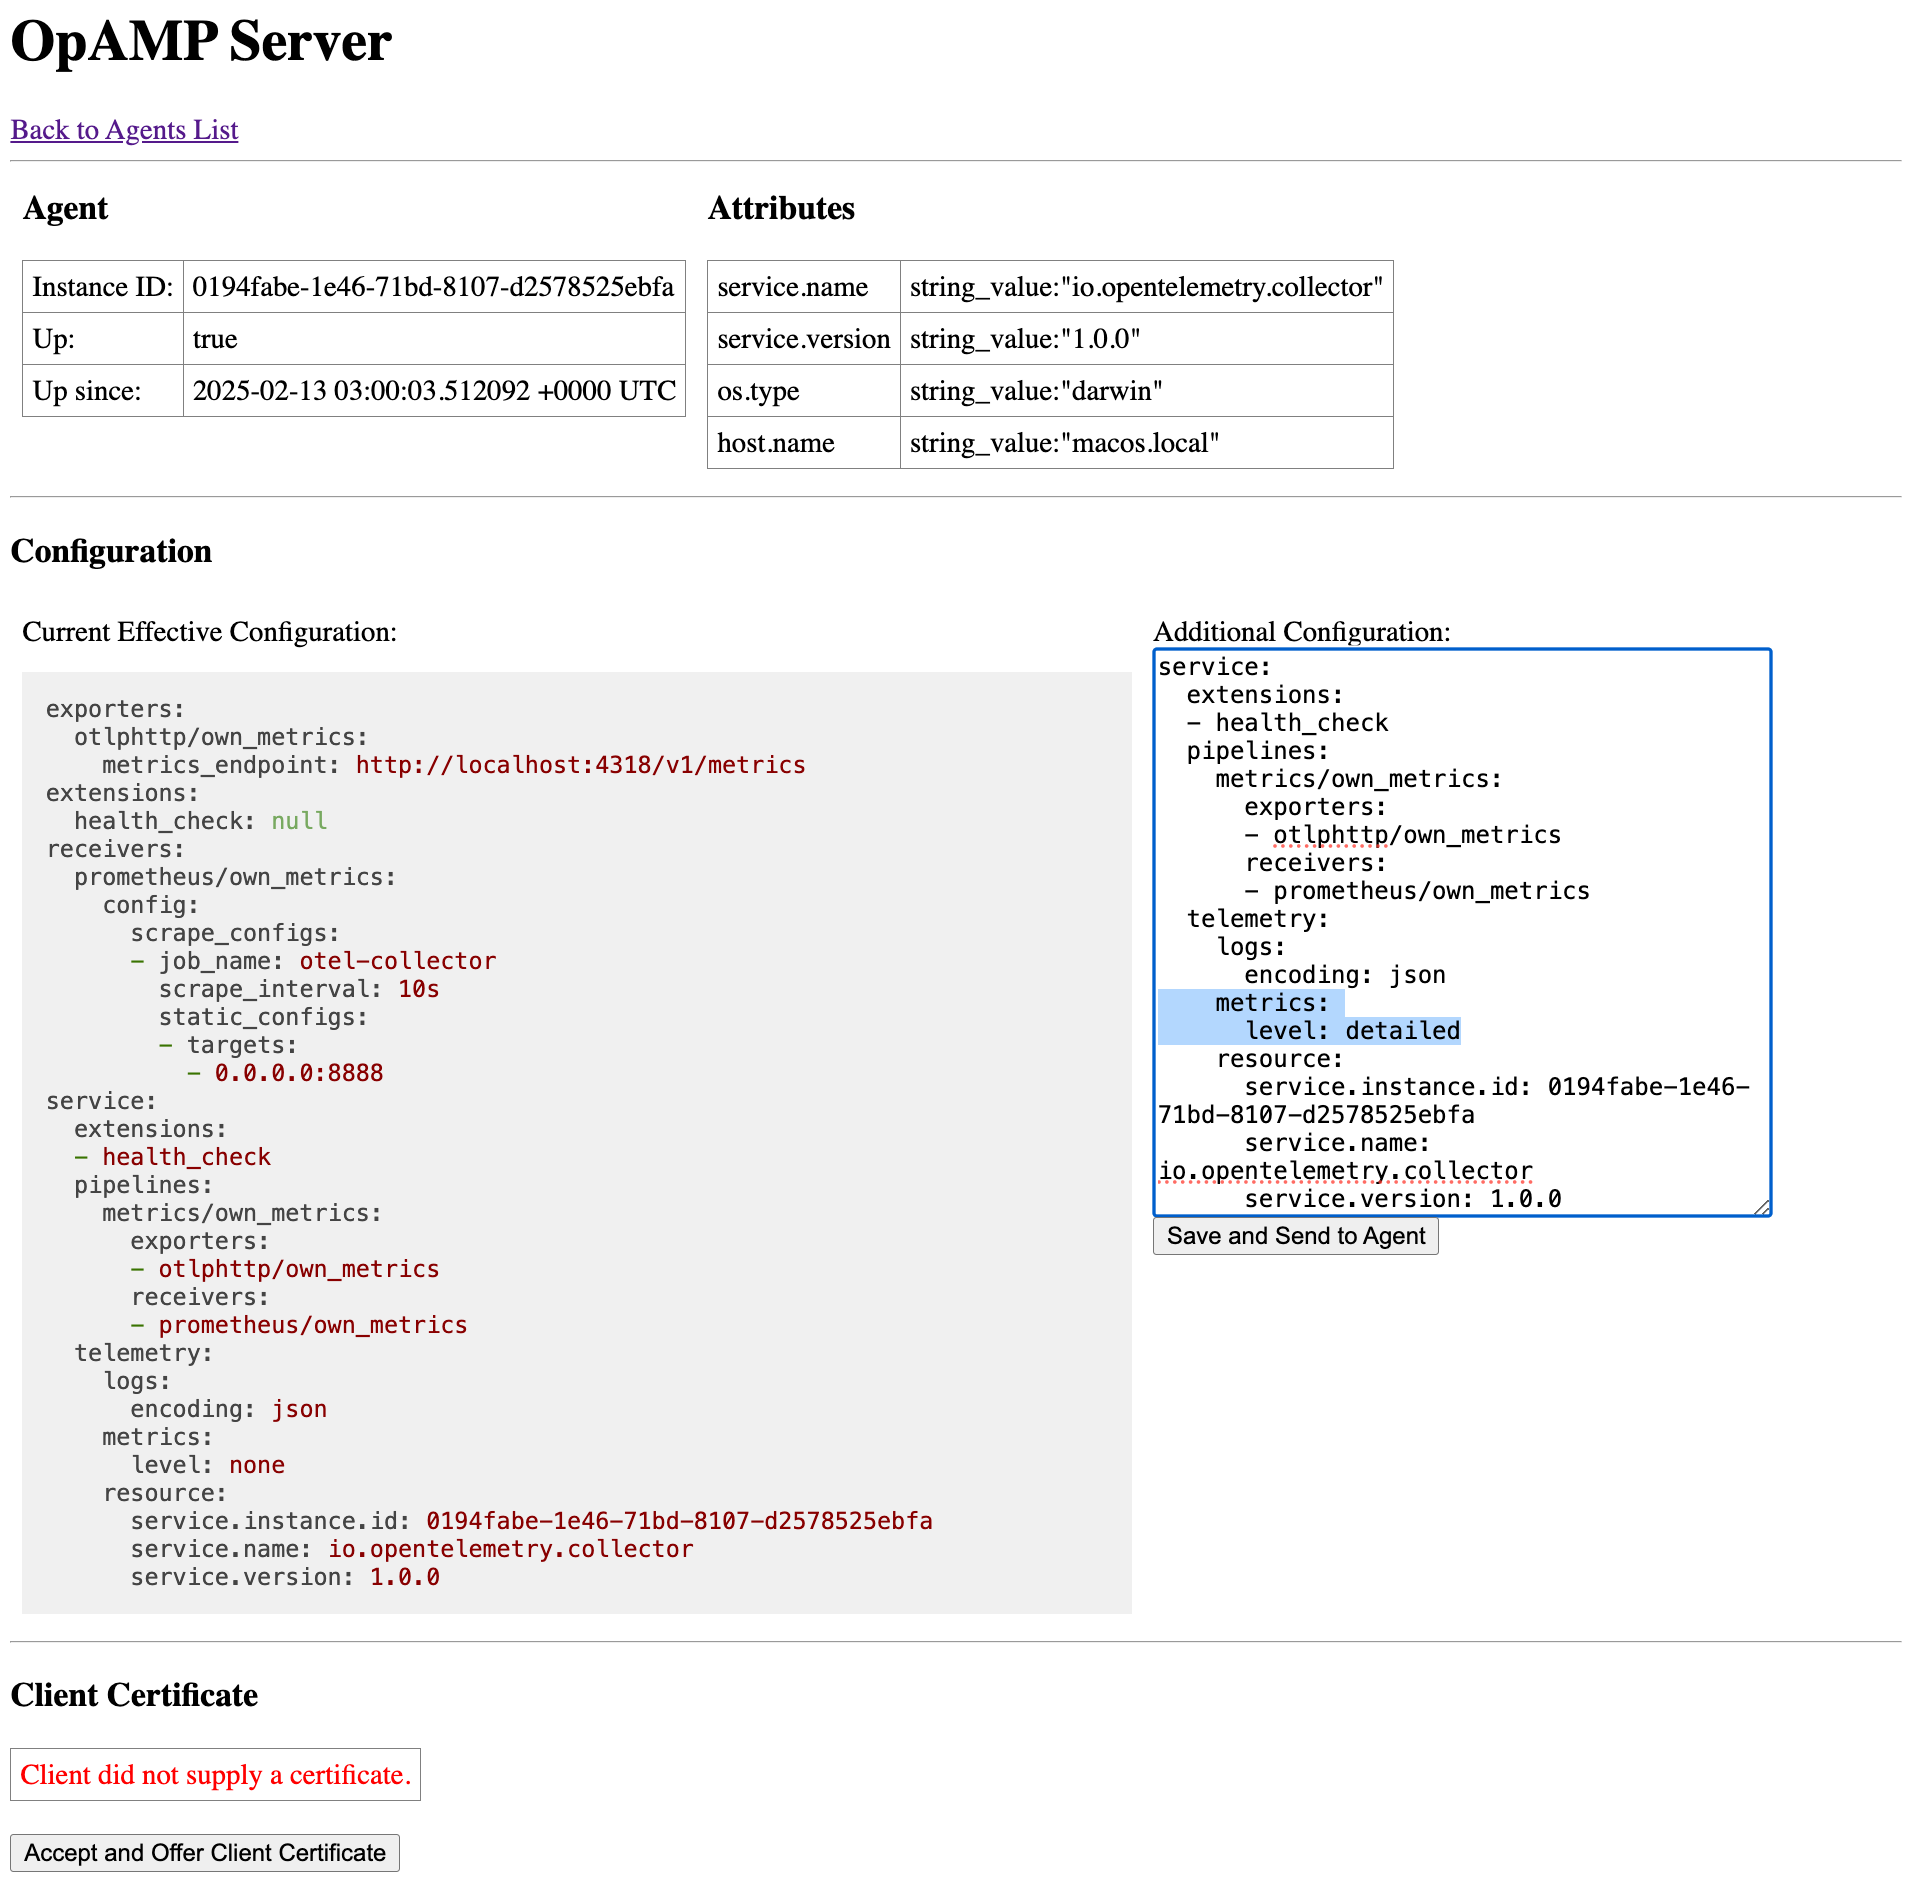
OpAMP Supervisor
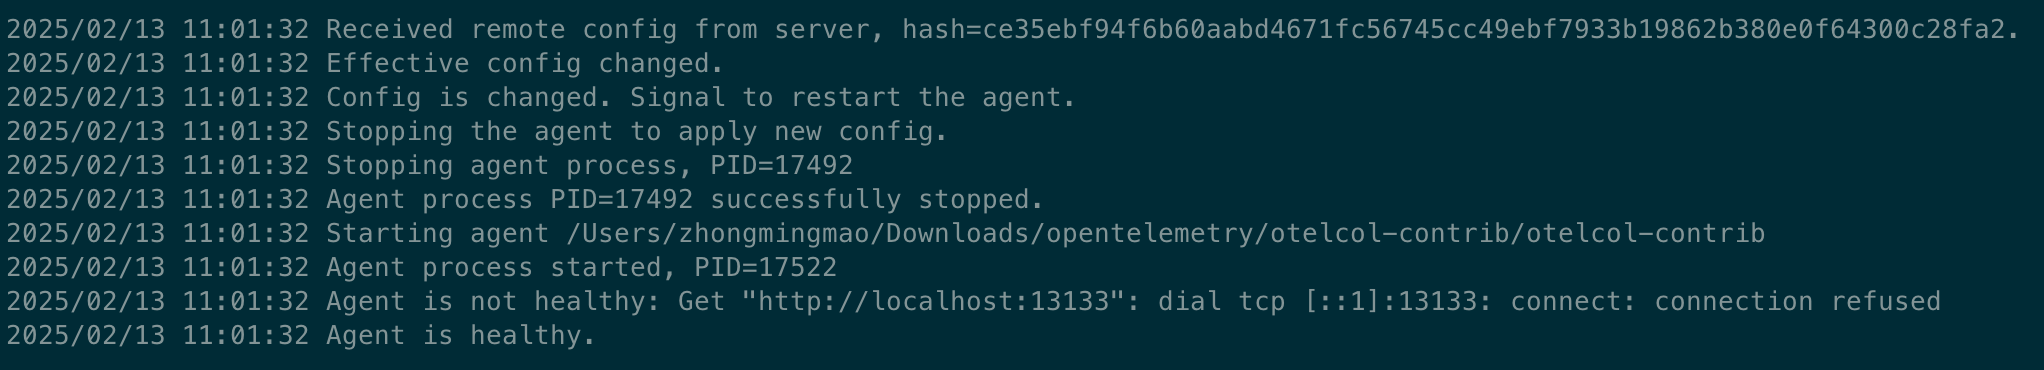
OpenTelemetry Collector
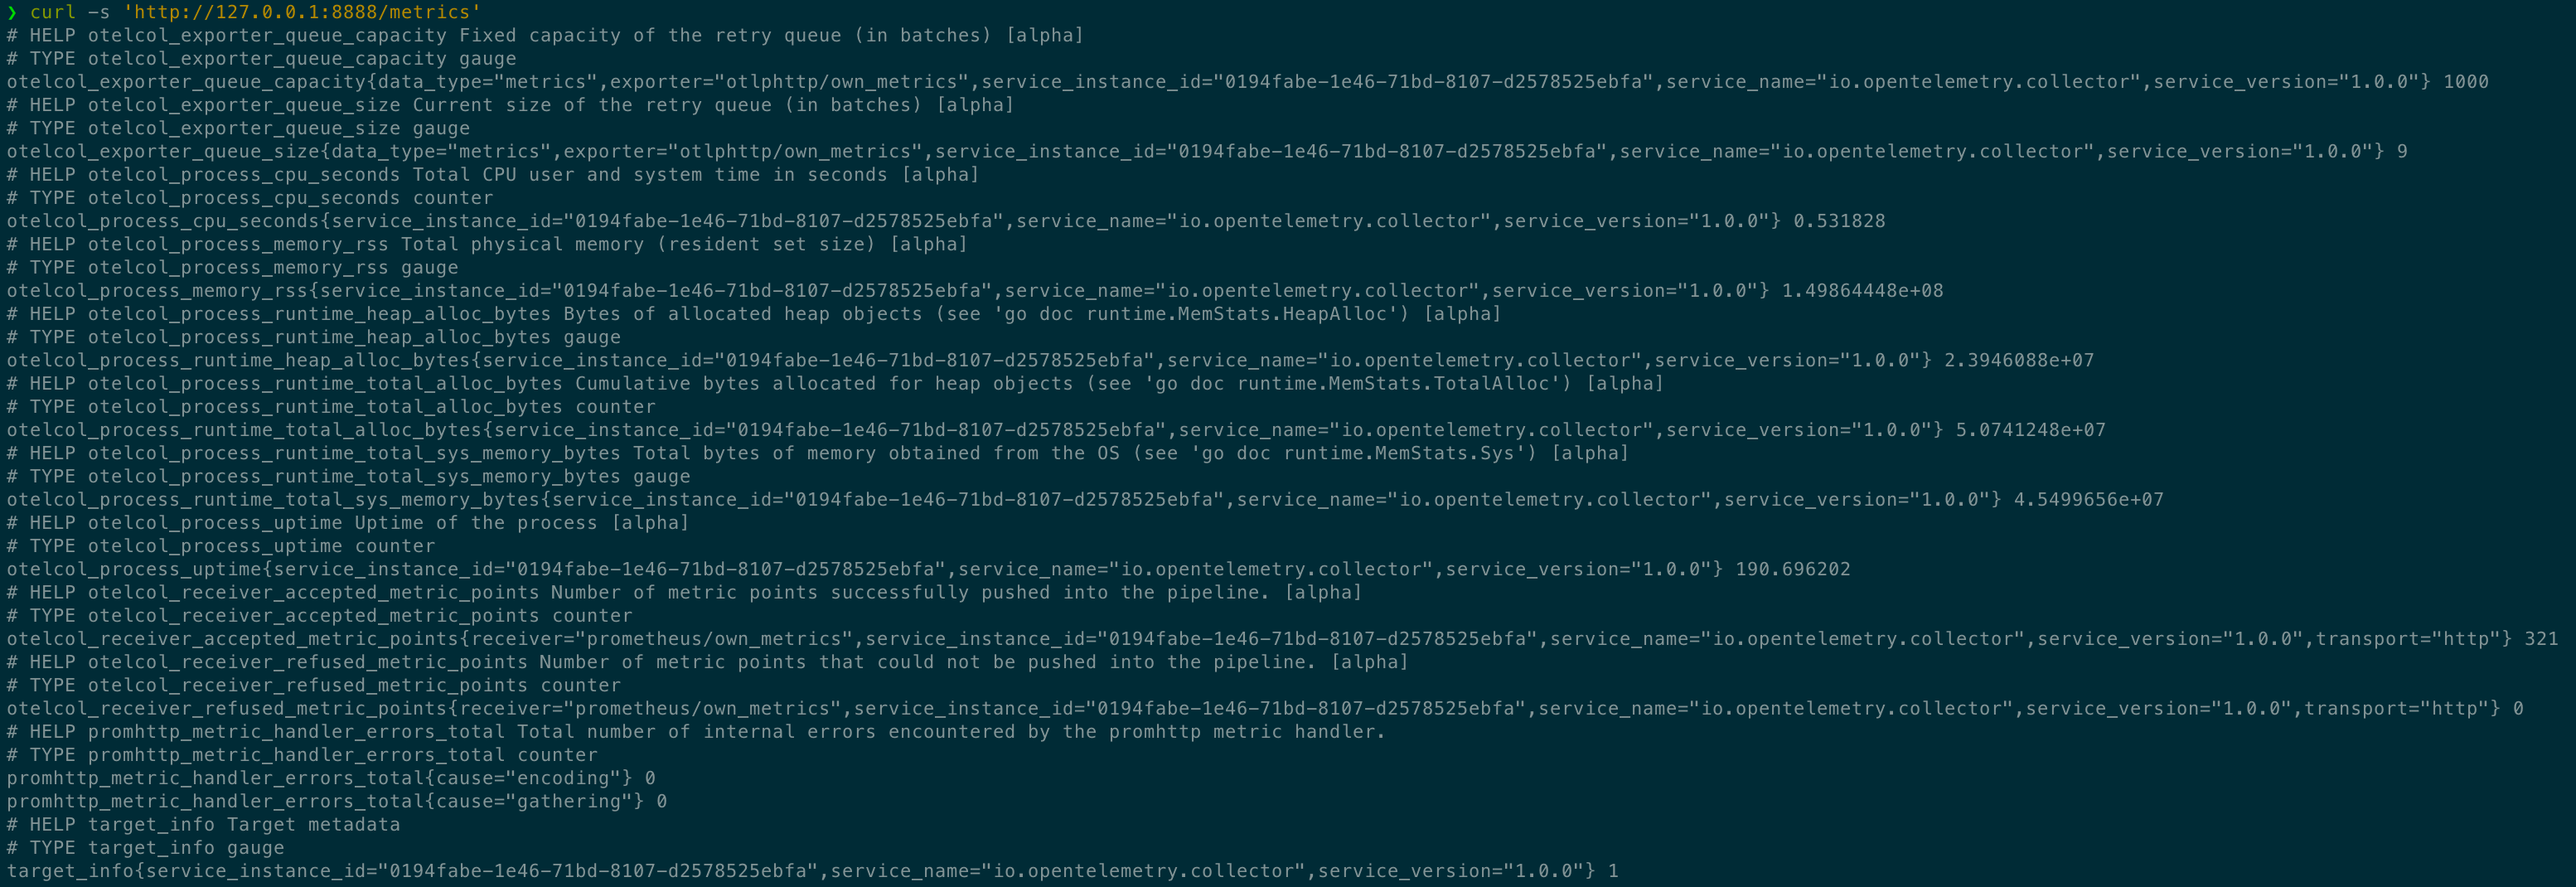
Configure internal logs
Log output is found in stderr. You can configure logs in the config service::telemetry::logs.
| Field name | Default value | Description |
|---|---|---|
| level | INFO | Sets the minimum enabled logging level. Other possible values are DEBUG, WARN, and ERROR. |
| development | false | Puts the logger in development mode. |
| encoding | console | Sets the logger’s encoding. The other possible value is json. |
| disable_caller | false | Stops annotating logs with the calling function’s file name and line number. By default, all logs are annotated. |
| disable_stacktrace | false | Disables automatic stacktrace capturing. Stacktraces are captured for logs at WARN level and above in development and at ERROR level and above in production. |
| sampling::enabled | true | Sets a sampling policy. |
| sampling::tick | 10s | The interval in seconds that the logger applies to each sampling. |
| sampling::initial | 10 | The number of messages logged at the start of each sampling::tick. |
| sampling::thereafter | 100 | Sets the sampling policy for subsequent messages after sampling::initial messages are logged. When sampling::thereafter is set to N, every Nth message is logged and all others are dropped. If N is zero, the logger drops all messages after sampling::initial messages are logged. |
| output_paths | [“stderr“] | A list of URLs or file paths to write logging output to. |
| error_output_paths | [“stderr“] | A list of URLs or file paths to write logger errors to. |
| initial_fields | A collection of static key-value pairs added to all log entries to enrich logging context. By default, there is no initial field. |
The following configuration can be used to emit internal logs from the Collector to an OTLP/HTTP backend:
1 | service: |
Configure internal traces
- The Collector does not expose traces by default, but it can be configured to.
- Internal tracing is an experimental feature, and no guarantees are made as to the stability of the emitted span names and attributes.
The following configuration can be used to emit internal traces from the Collector to an OTLP/gRPC backend:
1 | service: |
Types of internal telemetry
- The OpenTelemetry Collector aims to be a model of observable service by clearly exposing its own operational metrics.
- Additionally, it collects host resource metrics that can help you understand if problems are caused by a different process on the same host.
- Specific components of the Collector can also emit their own custom telemetry.
- In this section, you will learn about the different types of observability emitted by the Collector itself.
Summary of values observable with internal metrics
The Collector emits internal metrics for at least the following values:
- Process uptime and CPU time since start.
- Process memory and heap usage.
- For receivers: Items accepted and refused, per data type.
- For processors: Incoming and outgoing items.
- For exporters: Items the exporter sent, failed to enqueue, and failed to send, per data type.
- For exporters: Queue size and capacity.
- Count, duration, and size of HTTP/gRPC requests and responses.
Lists of internal metrics
- The following tables group each internal metric by level of verbosity: basic, normal, and detailed.
- Each metric is identified by name and description and categorized by instrumentation type.
- As of Collector v0.106.1, internal metric names are handled differently based on their source:
- Metrics generated from Collector components are prefixed with otelcol_.
- Metrics generated from instrumentation libraries do not use the otelcol_ prefix by default, unless their metric names are explicitly prefixed.
- For Collector versions prior to v0.106.1
- all internal metrics emitted using the Prometheus exporter, regardless of their origin, are prefixed with otelcol_.
- This includes metrics from both Collector components and instrumentation libraries.
basic-level metrics
| Metric name | Description | Type |
|---|---|---|
| otelcol_exporter_enqueue_failed_log_records | Number of logs that exporter(s) failed to enqueue. | Counter |
| otelcol_exporter_enqueue_failed_metric_points | Number of metric points that exporter(s) failed to enqueue. | Counter |
| otelcol_exporter_enqueue_failed_spans | Number of spans that exporter(s) failed to enqueue. | Counter |
| otelcol_exporter_queue_capacity | Fixed capacity of the sending queue, in batches. | Gauge |
| otelcol_exporter_queue_size | Current size of the sending queue, in batches. | Gauge |
| otelcol_exporter_send_failed_log_records | Number of logs that exporter(s) failed to send to destination. | Counter |
| otelcol_exporter_send_failed_metric_points | Number of metric points that exporter(s) failed to send to destination. | Counter |
| otelcol_exporter_send_failed_spans | Number of spans that exporter(s) failed to send to destination. | Counter |
| otelcol_exporter_sent_log_records | Number of logs successfully sent to destination. | Counter |
| otelcol_exporter_sent_metric_points | Number of metric points successfully sent to destination. | Counter |
| otelcol_exporter_sent_spans | Number of spans successfully sent to destination. | Counter |
| otelcol_process_cpu_seconds | Total CPU user and system time in seconds. | Counter |
| otelcol_process_memory_rss | Total physical memory (resident set size) in bytes. | Gauge |
| otelcol_process_runtime_heap_alloc_bytes | Bytes of allocated heap objects see ‘go doc runtime.MemStats.HeapAlloc’ |
Gauge |
| otelcol_process_runtime_total_alloc_bytes | Cumulative bytes allocated for heap objects see ‘go doc runtime.MemStats.TotalAlloc’ |
Counter |
| otelcol_process_runtime_total_sys_memory_bytes | Total bytes of memory obtained from the OS see ‘go doc runtime.MemStats.Sys’ |
Gauge |
| otelcol_process_uptime | Uptime of the process in seconds. | Counter |
| otelcol_processor_batch_batch_send_size | Number of units in the batch that was sent. | Histogram |
| otelcol_processor_batch_batch_size_trigger_send | Number of times the batch was sent due to a size trigger. | Counter |
| otelcol_processor_batch_metadata_cardinality | Number of distinct metadata value combinations being processed. | Counter |
| otelcol_processor_batch_timeout_trigger_send | Number of times the batch was sent due to a timeout trigger. | Counter |
| otelcol_processor_incoming_items | Number of items passed to the processor. | Counter |
| otelcol_processor_outgoing_items | Number of items emitted from the processor. | Counter |
| otelcol_receiver_accepted_log_records | Number of logs successfully ingested and pushed into the pipeline. | Counter |
| otelcol_receiver_accepted_metric_points | Number of metric points successfully ingested and pushed into the pipeline. | Counter |
| otelcol_receiver_accepted_spans | Number of spans successfully ingested and pushed into the pipeline. | Counter |
| otelcol_receiver_refused_log_records | Number of logs that could not be pushed into the pipeline. | Counter |
| otelcol_receiver_refused_metric_points | Number of metric points that could not be pushed into the pipeline. | Counter |
| otelcol_receiver_refused_spans | Number of spans that could not be pushed into the pipeline. | Counter |
| otelcol_scraper_errored_metric_points | Number of metric points the Collector failed to scrape. | Counter |
| otelcol_scraper_scraped_metric_points | Number of metric points scraped by the Collector. | Counter |
Additional normal-level metrics
There are currently no metrics specific to normal verbosity.
Additional detailed-level metrics
| Metric name | Description | Type |
|---|---|---|
| http_client_active_requests | Number of active HTTP client requests. | Counter |
| http_client_connection_duration | Measures the duration of the successfully established outbound HTTP connections. | Histogram |
| http_client_open_connections | Number of outbound HTTP connections that are active or idle on the client. | Counter |
| http_client_request_size | Measures the size of HTTP client request bodies. | Counter |
| http_client_duration | Measures the duration of HTTP client requests. | Histogram |
| http_client_response_size | Measures the size of HTTP client response bodies. | Counter |
| http_server_active_requests | Number of active HTTP server requests. | Counter |
| http_server_request_size | Measures the size of HTTP server request bodies. | Counter |
| http_server_duration | Measures the duration of HTTP server requests. | Histogram |
| http_server_response_size | Measures the size of HTTP server response bodies. | Counter |
| otelcol_processor_batch_batch_send_size_bytes | Number of bytes in the batch that was sent. | Histogram |
| rpc_client_duration | Measures the duration of outbound RPC. | Histogram |
| rpc_client_request_size | Measures the size of RPC request messages (uncompressed). | Histogram |
| rpc_client_requests_per_rpc | Measures the number of messages received per RPC. Should be 1 for all non-streaming RPCs. |
Histogram |
| rpc_client_response_size | Measures the size of RPC response messages (uncompressed). | Histogram |
| rpc_client_responses_per_rpc | Measures the number of messages sent per RPC. Should be 1 for all non-streaming RPCs. |
Histogram |
| rpc_server_duration | Measures the duration of inbound RPC. | Histogram |
| rpc_server_request_size | Measures the size of RPC request messages (uncompressed). | Histogram |
| rpc_server_requests_per_rpc | Measures the number of messages received per RPC. Should be 1 for all non-streaming RPCs. |
Histogram |
| rpc_server_response_size | Measures the size of RPC response messages (uncompressed). | Histogram |
| rpc_server_responses_per_rpc | Measures the number of messages sent per RPC. Should be 1 for all non-streaming RPCs. |
Histogram |
- The http_ and rpc_ metrics come from instrumentation libraries.
- Their original names use dots (.), but when exposing internal metrics with Prometheus
- they are translated to use underscores (_) to match Prometheus’ naming constraints.
- The otelcol_processor_batch_ metrics are unique to the batchprocessor.
- The otelcol_receiver_, otelcol_scraper_, otelcol_processor_, and otelcol_exporter_ metrics come from their respective helper packages.
- As such, some components not using those packages may not emit them.
Events observable with internal logs
The Collector logs the following internal events:
- A Collector instance starts or stops.
- Data dropping begins due to throttling for a specified reason, such as local saturation, downstream saturation, downstream unavailable, etc.
- Data dropping due to throttling stops.
- Data dropping begins due to invalid data. A sample of the invalid data is included.
- Data dropping due to invalid data stops.
- A crash is detected, differentiated from a clean stop.
- Crash data is included if available.
Telemetry maturity levels
Traces
no guarantees of backwards compatibility
- Tracing instrumentation is still under active development
- and changes might be made to span names, attached attributes, instrumented endpoints, or other aspects of the telemetry.
- Until this feature graduates to stable, there are no guarantees of backwards compatibility for tracing instrumentation.
Metrics
- The Collector’s metrics follow a four-stage lifecycle:
- Alpha metric → Stable metric → Deprecated metric → Deleted metric
Alpha
- Alpha metrics have no stability guarantees.
- These metrics can be modified or deleted at any time.
Stable
Stable metrics are guaranteed to not change. This means:
- A stable metric without a deprecated signature will not be deleted or renamed.
- A stable metric’s type and attributes will not be modified.
Deprecated
- Deprecated metrics are slated for deletion but are still available for use.
- The description of these metrics include an annotation about the version in which they became deprecated.
Before deprecation:
1 | # HELP otelcol_exporter_queue_size this counts things |
After deprecation:
1 | # HELP otelcol_exporter_queue_size (Deprecated since 1.15.0) this counts things |
Deleted
Deleted metrics are no longer published and cannot be used.
Logs
Individual log entries and their formatting might change from one release to the next. There are no stability guarantees at this time.
Use internal telemetry to monitor the Collector
This section recommends best practices for monitoring the Collector using its own telemetry.
Monitoring
Queue length
- Most exporters provide a queue and/or retry mechanism that is recommended for use in any production deployment of the Collector.
- The otelcol_exporter_queue_capacity metric indicates the capacity, in batches, of the sending queue.
- The otelcol_exporter_queue_size metric indicates the current size of the sending queue.
- Use these two metrics to check if the queue capacity can support your workload.
- Using the following three metrics, you can identify the number of spans, metric points, and log records that failed to reach the sending queue:
- otelcol_exporter_enqueue_failed_spans
- otelcol_exporter_enqueue_failed_metric_points
- otelcol_exporter_enqueue_failed_log_records
- These failures could be caused by a queue filled with unsettled elements.
- You might need to decrease your sending rate or horizontally scale Collectors.
- The queue or retry mechanism also supports logging for monitoring.
- Check the logs for messages such as Dropping data because sending_queue is full.
Receive failures
- Sustained rates of otelcol_receiver_refused_log_records, otelcol_receiver_refused_spans, and otelcol_receiver_refused_metric_points
- indicate that too many errors were returned to clients.
- Sustained rates of otelcol_exporter_send_failed_log_records, otelcol_exporter_send_failed_spans, and otelcol_exporter_send_failed_metric_points
- indicate that the Collector is not able to export data as expected.
- These metrics do not inherently imply data loss since there could be retries.
- But a high rate of failures could indicate issues with the network or backend receiving the data.
Data flow
- You can monitor data ingress
- with the otelcol_receiver_accepted_log_records, otelcol_receiver_accepted_spans, and otelcol_receiver_accepted_metric_points metrics
- and data egress
- with the otelcol_exporter_sent_log_records, otelcol_exporter_sent_spans, and otelcol_exporter_sent_metric_points metrics.
Troubleshooting
On this page, you can learn how to troubleshoot the health and performance of the OpenTelemetry Collector.
Troubleshooting tools
The Collector provides a variety of metrics, logs, and extensions for debugging issues.
Internal telemetry
You can configure and use the Collector’s own internal telemetry to monitor its performance.
Local exporters
- For certain types of issues, such as configuration verification and network debugging
- you can send a small amount of test data to a Collector configured to output to local logs.
- Using a local exporter, you can inspect the data being processed by the Collector.
For live troubleshooting, consider using the debug exporter, which can confirm that the Collector is receiving, processing, and exporting data.
1 | receivers: |
To begin testing, generate a Zipkin payload. For example, you can create a file called trace.json that contains:
1 | [ |
With the Collector running, send this payload to the Collector:
1 | $ otelcol-contrib --config config.yaml |
1 | $ curl -v -X POST localhost:9411/api/v2/spans -H'Content-Type: application/json' -d @trace.json |
You should see a log entry like the following:
1 | 2025-02-13T14:40:50.938+0800 info Traces {"kind": "exporter", "data_type": "traces", "name": "debug", "resource spans": 1, "spans": 1} |
You can also configure the debug exporter so the entire payload is printed:
1 | exporters: |
If you re-run the previous test with the modified configuration, the log output looks like this:
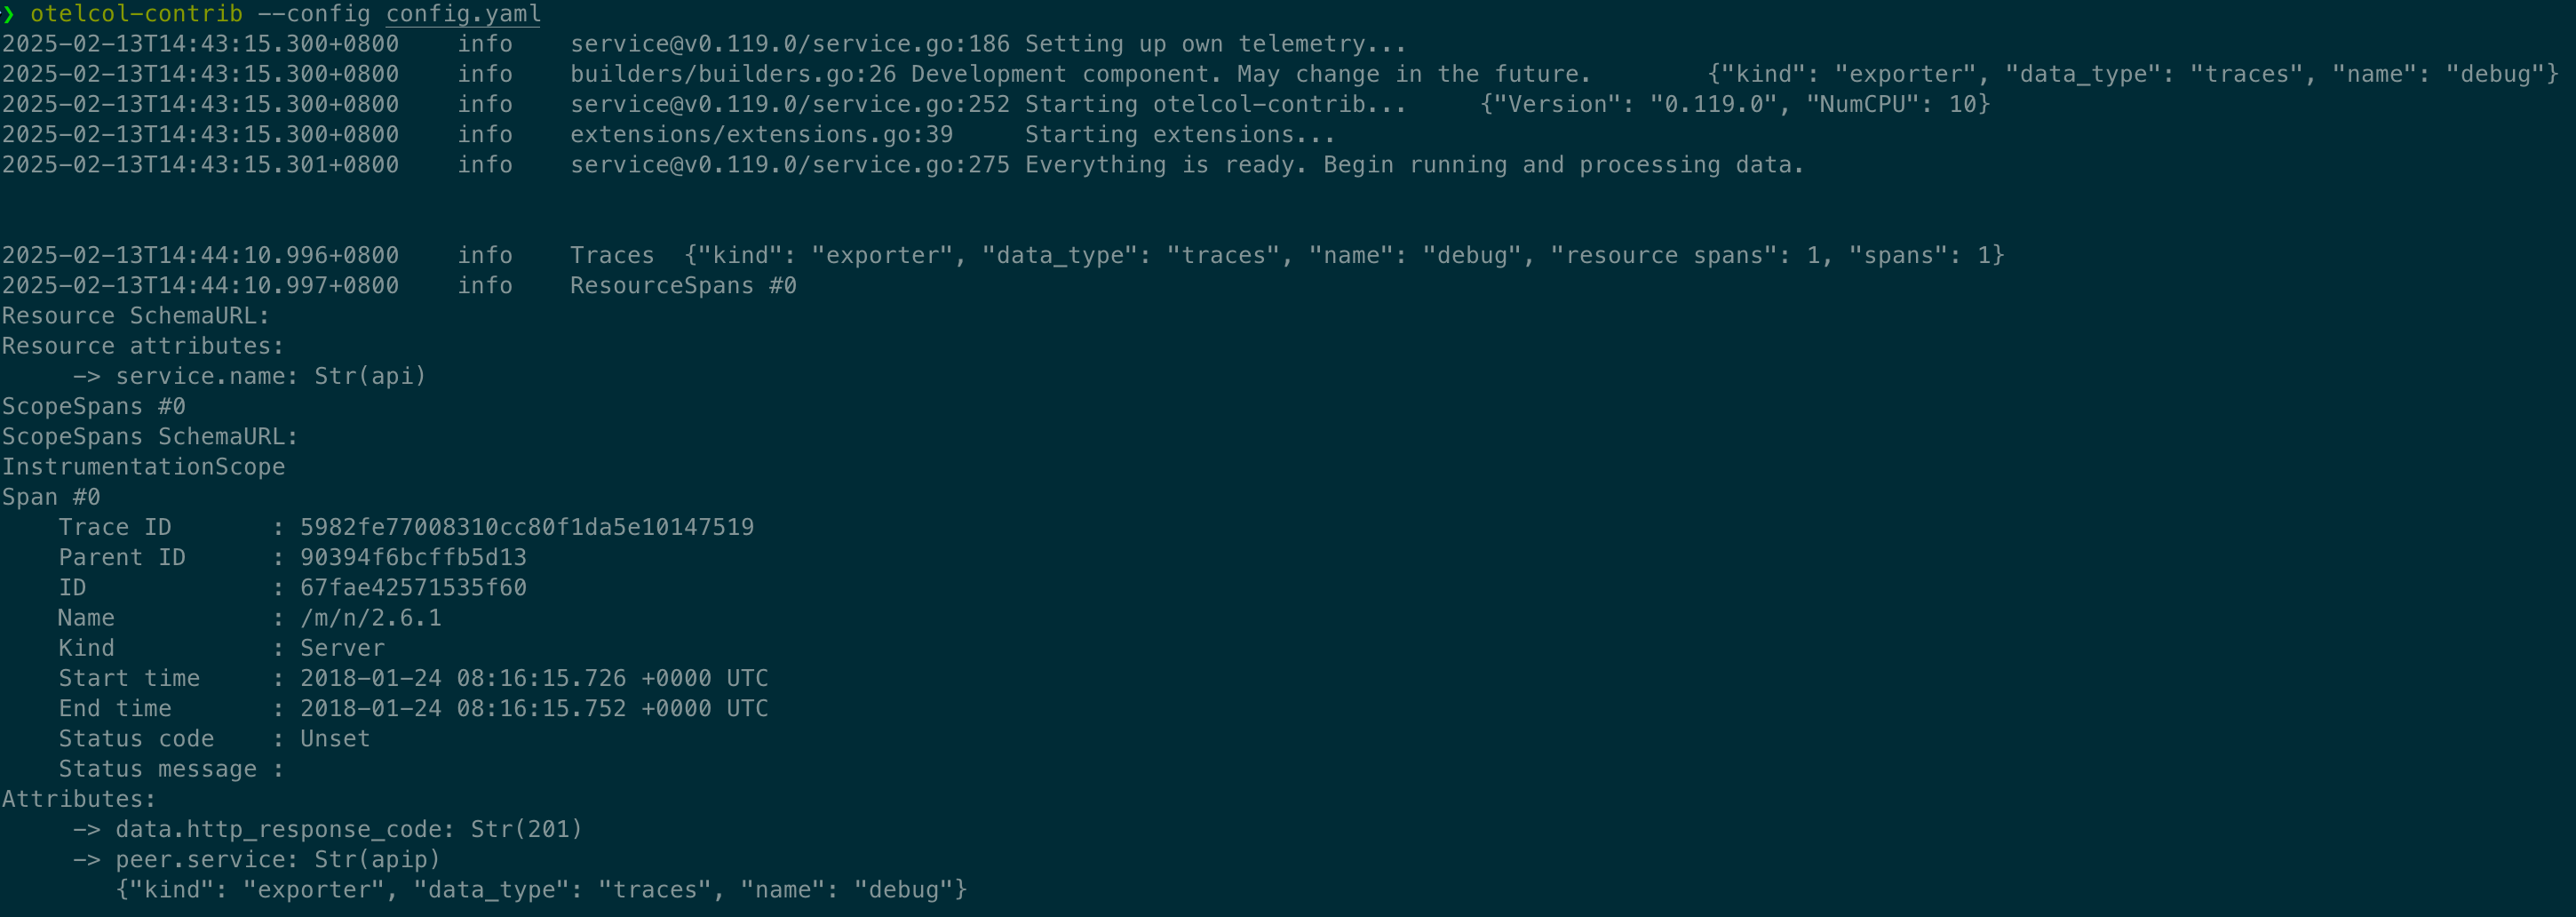
Check Collector components
- Use the following sub-command to list the available components in a Collector distribution, including their stability levels.
- Please note that the output format might change across versions.
1 | otelcol-otlp components |
1 | buildinfo: |
Extensions
Here is a list of extensions you can enable for debugging the Collector.
Performance Profiler (pprof)
- The pprof extension, which is available locally on port 1777, allows you to profile the Collector as it runs.
- This is an advanced use-case that should not be needed in most circumstances.
zPages
- The zPages extension, which is exposed locally on port 55679, can be used to inspect live data from the Collector’s receivers and exporters.
- The TraceZ page, exposed at /debug/tracez, is useful for debugging trace operations, such as:
- Latency issues. Find the slow parts of an application.
- Deadlocks and instrumentation problems. Identify running spans that don’t end.
- Errors. Determine what types of errors are occurring and where they happen.
- Note that zpages might contain error logs that the Collector does not emit itself.
- For containerized environments, you might want to expose this port on a public interface instead of just locally.
- the endpoint can be configured using the extensions configuration section:
1 | receivers: |
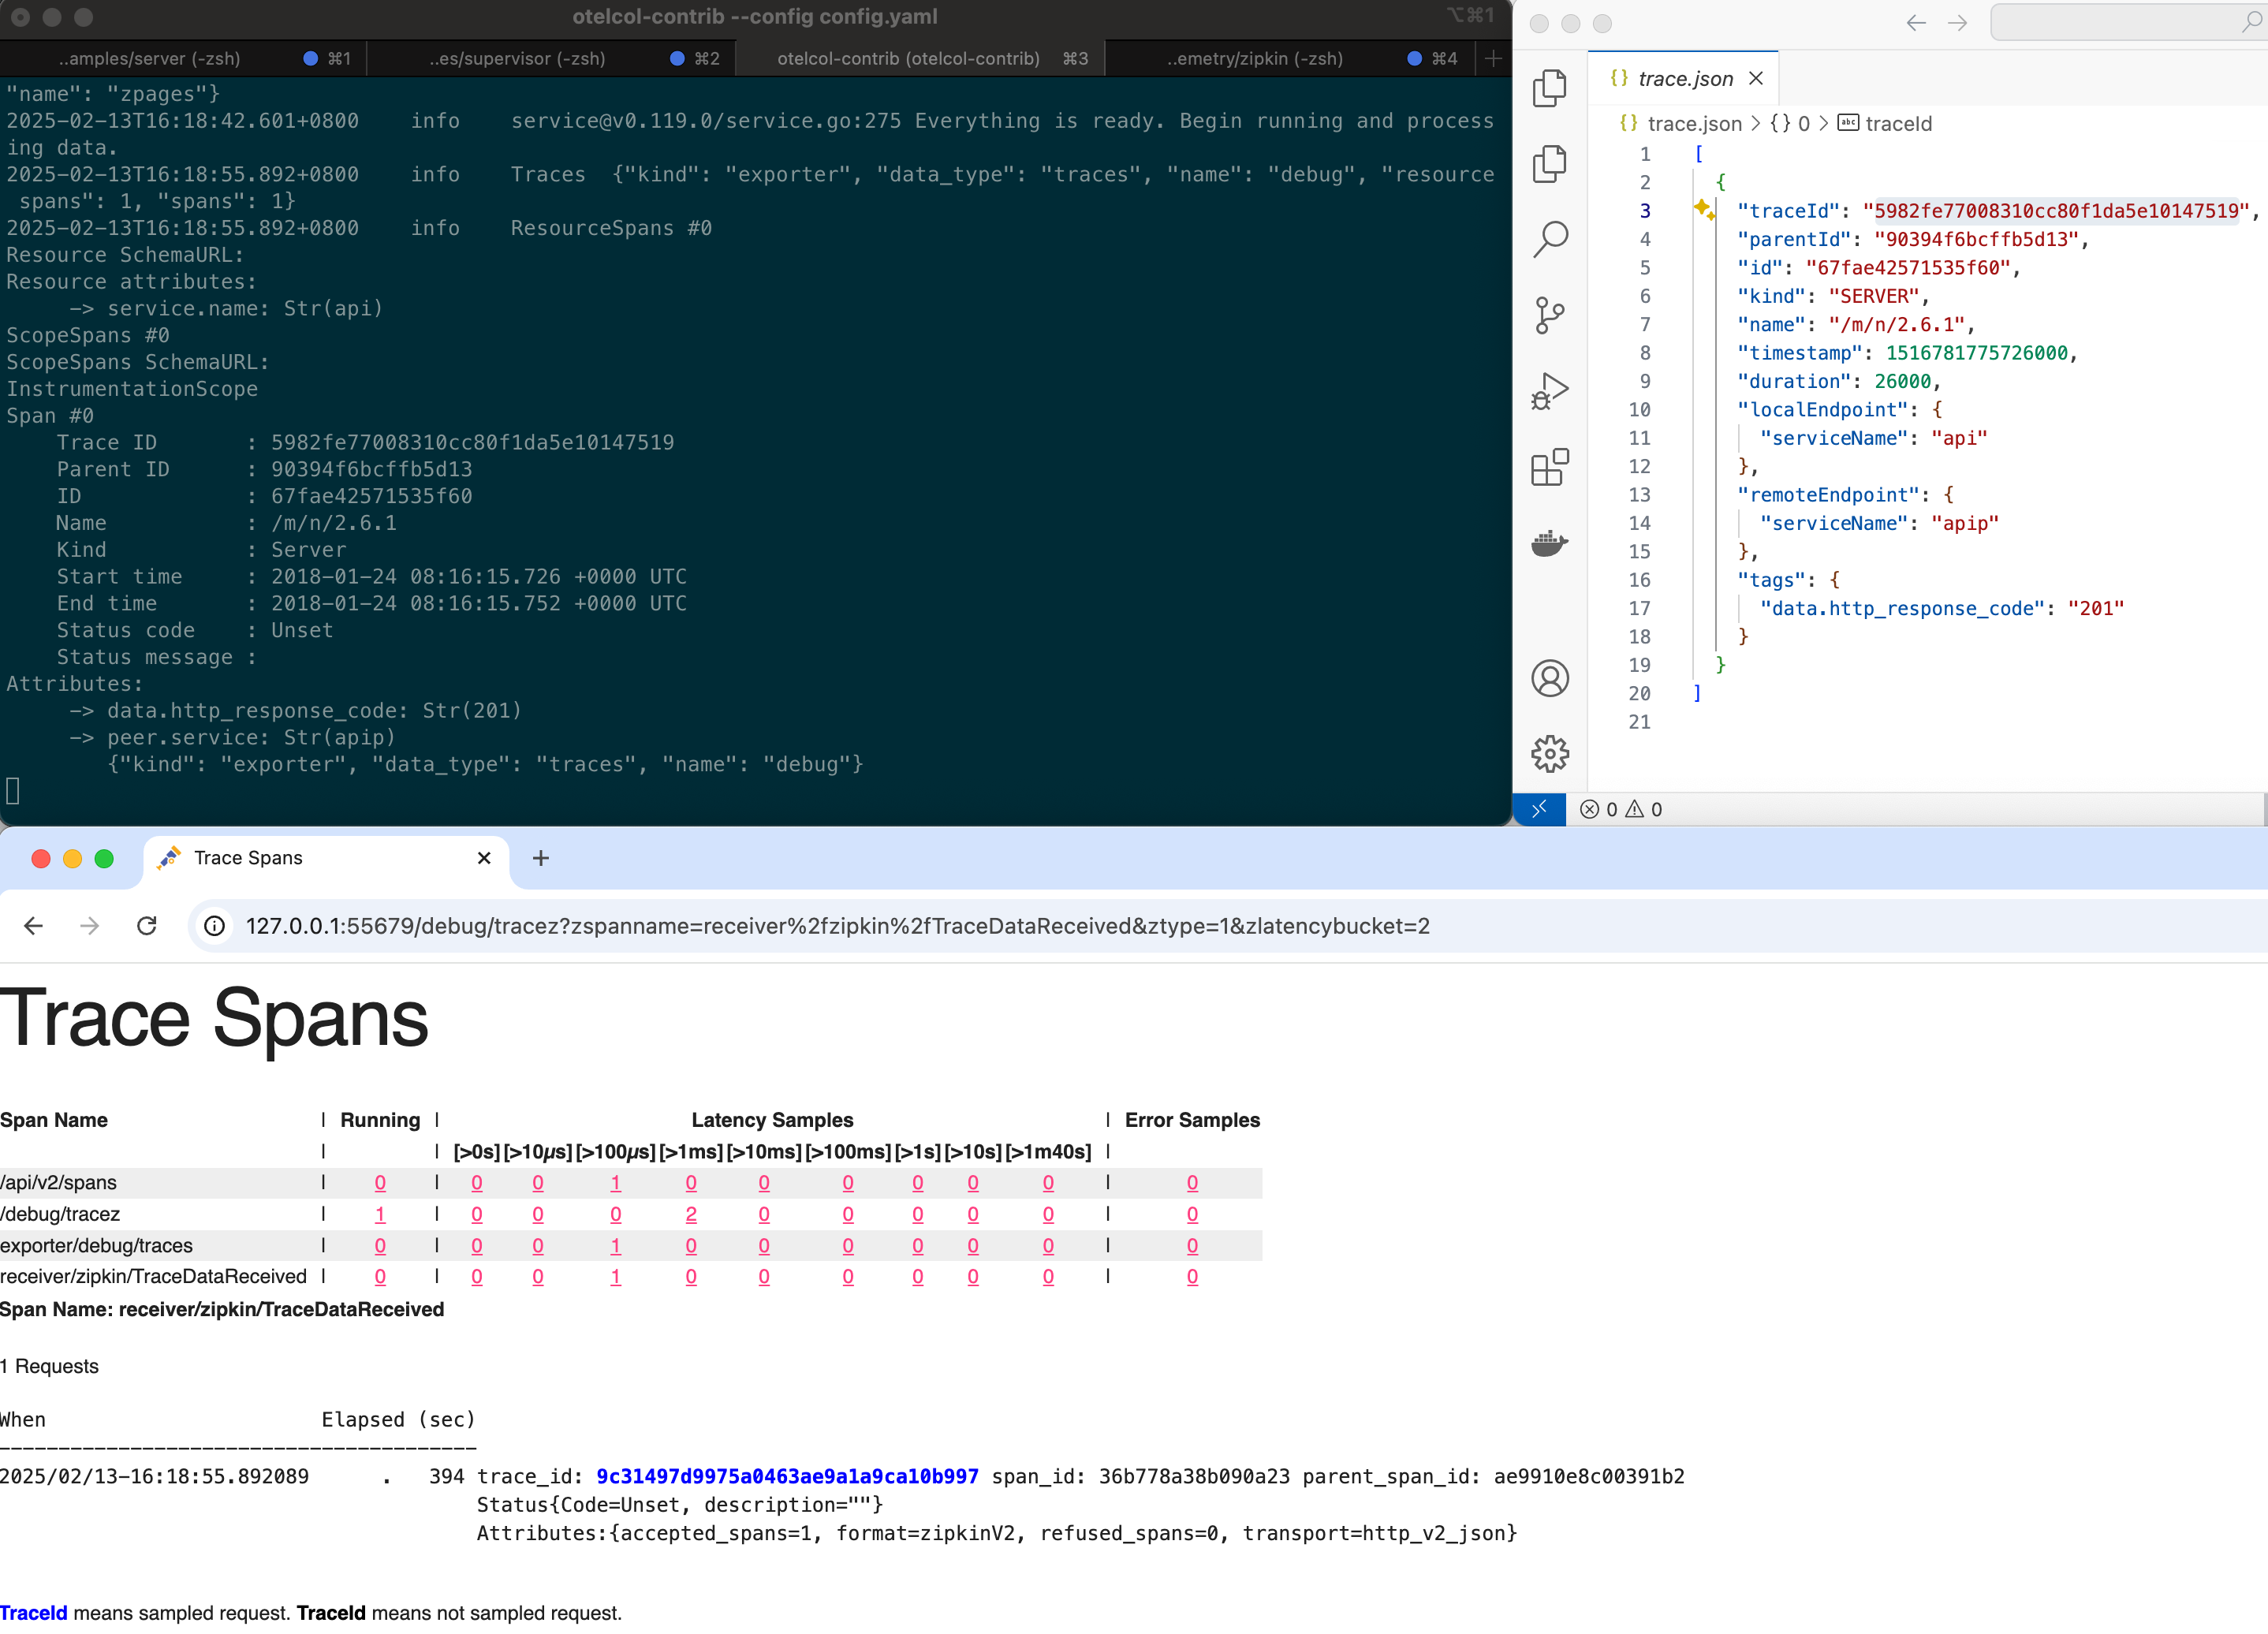
Checklist for debugging complex pipelines
- It can be difficult to isolate problems when telemetry flows through multiple Collectors and networks.
- For each “hop” of telemetry through a Collector or other component in your pipeline, it’s important to verify the following:
- Are there error messages in the logs of the Collector?
- How is the telemetry being ingested into this component?
- How is the telemetry being modified (for example, sampling or redacting) by this component?
- How is the telemetry being exported from this component?
- What format is the telemetry in?
- How is the next hop configured?
- Are there any network policies that prevent data from getting in or out?
Common Collector issues
Data issues
The Collector and its components might experience data issues.
Collector is dropping data
- The Collector might drop data for a variety of reasons, but the most common are
- The Collector is improperly sized, resulting in an inability to process and export the data as fast as it is received.
- The exporter destination is unavailable or accepting the data too slowly.
- To mitigate drops, configure the batch processor. In addition, it might be necessary to configure the queued retry options on enabled exporters.
Collector is not receiving data
- The Collector might not receive data for the following reasons:
- A network configuration issue.
- An incorrect receiver configuration.
- An incorrect client configuration.
- The receiver is defined in the receivers section but not enabled in any pipelines.
- Check the Collector’s logs as well as zPages for potential issues.
Collector is not processing data
Most processing issues result from of a misunderstanding of how the processor works or a misconfiguration of the processor
- The attributes processor works only for “tags” on spans. The span name is handled by the span processor.
- Processors for trace data (except tail sampling) work only on individual spans.
Collector is not exporting data
- The Collector might not export data for the following reasons:
- A network configuration issue.
- An incorrect exporter configuration.
- The destination is unavailable.
- Check the Collector’s logs as well as zPages for potential issues.
- Exporting data often does not work because of a network configuration issue
- such as a firewall, DNS, or proxy issue. Note that the Collector does have proxy support
Control issues
The Collector might experience failed startups or unexpected exits or restarts.
Collector exits or restarts
The Collector might exit or restart due to:
- Memory pressure from a missing or misconfigured memory_limiter processor.
- Improper sizing for load.
- Improper configuration. For example, a queue sized to be larger than available memory.
- Infrastructure resource limits. For example, Kubernetes.
Configuration issues
The Collector might experience problems due to configuration issues.
Null maps
During configuration resolution of multiple configs, values in earlier configs are removed in favor of later configs, even if the later value is null.
- Using {} to represent an empty map, such as processors: {} instead of processors:.
- Omitting empty configurations such as processors: from the configuration.
Scaling the Collector
- When planning your observability pipeline with the OpenTelemetry Collector
- you should consider ways to scale the pipeline as your telemetry collection increases.
- The following sections will guide you through the planning phase discussing which components to scale
- how to determine when it’s time to scale up
- and how to execute the plan
What to Scale
- While the OpenTelemetry Collector handles all telemetry signal types in a single binary
- the reality is that each type may have different scaling needs and might require different scaling strategies.
- Start by looking at your workload to determine which signal type is expected to have the biggest share of the load
- and which formats are expected to be received by the Collector.
- For instance, scaling a scraping cluster differs significantly from scaling log receivers.
- Think also about how elastic the workload is
- do you have peaks at specific times of the day, or is the load similar across all 24 hours?
- For example
- suppose you have hundreds of Prometheus endpoints to be scraped
- a terabyte of logs coming from fluentd instances every minute
- and some application metrics and traces arriving in OTLP format from your newest microservices.
- In that scenario, you’ll want an architecture that can scale each signal individually
- scaling the Prometheus receivers requires coordination among the scrapers to decide which scraper goes to which endpoint.
- In contrast, we can horizontally scale the stateless log receivers on demand.
- Having the OTLP receiver for metrics and traces in a third cluster of Collectors
- would allow us to isolate failures and iterate faster without fear of restarting a busy pipeline.
- Given that the OTLP receiver enables the ingestion of all telemetry types
- we can keep the application metrics and traces on the same instance, scaling them horizontally when needed.
When to Scale
- Once again, we should understand our workload to decide when it’s time to scale up or down
- but a few metrics emitted by the Collector can give you good hints on when to take action.
- One helpful hint the Collector can give you when the memory_limiter processor is part of the pipeline is the metric otelcol_processor_refused_spans
- This processor allows you to restrict the amount of memory the Collector can use.
- While the Collector may consume a bit more than the maximum amount configured in this processor
- new data will eventually be blocked from passing through the pipeline by the memory_limiter, which will record the fact in this metric.
- The same metric exists for all other telemetry data types.
- If data is being refused from entering the pipeline too often, you’ll probably want to scale up your Collector cluster.
- You can scale down once the memory consumption across the nodes is significantly lower than the limit set in this processor.
- Another set of metrics to keep in sight are the ones related to the queue sizes for exporters
- otelcol_exporter_queue_capacity and otelcol_exporter_queue_size.
- The Collector will queue data in memory while waiting for a worker to become available to send the data.
- If there aren’t enough workers or the backend is too slow, data starts piling up in the queue.
- Once the queue has hit its capacity (otelcol_exporter_queue_size > otelcol_exporter_queue_capacity)
- it rejects data (otelcol_exporter_enqueue_failed_spans).
- Adding more workers will often make the Collector export more data, which might not necessarily be what you want
- It’s also worth getting familiar with the components that you intend to use, as different components might produce other metrics.
- For instance, the load-balancing exporter will record timing information about the export operations
- exposing this as part of the histogram otelcol_loadbalancer_backend_latency.
- You can extract this information to determine whether all backends are taking a similar amount of time to process requests
- single backends being slow might indicate problems external to the Collector.
- For receivers doing scraping, such as the Prometheus receiver, the scraping should be scaled, or sharded
- once the time it takes to finish scraping all targets often becomes critically close to the scrape interval.
- When that happens, it’s time to add more scrapers, usually new instances of the Collector.
| Collector metrics | Desc |
|---|---|
| otelcol_processor_refused_spans | memory_limiter processor |
| otelcol_exporter_enqueue_failed_spans | queue is full |
| otelcol_loadbalancer_backend_latency | external |
When NOT to scale
- Perhaps as important as knowing when to scale is to understand which signs indicate that a scaling operation won’t bring any benefits.
- One example is when a telemetry database can’t keep up with the load: adding Collectors to the cluster won’t help without scaling up the database.
- when the network connection between the Collector and the backend is saturated, adding more Collectors might cause a harmful side effect.
- Again, one way to catch this situation is by looking at the metrics otelcol_exporter_queue_size and otelcol_exporter_queue_capacity.
- If you keep having the queue size close to the queue capacity, it’s a sign that exporting data is slower than receiving data.
- You can try to increase the queue size, which will cause the Collector to consume more memory
- but it will also give some room for the backend to breathe without permanently dropping telemetry data.
- But if you keep increasing the queue capacity and the queue size keeps rising at the same proportion
- it’s indicative that you might want to look outside of the Collector.
- It’s also important to note that adding more workers here would not be helpful
- you’ll only be putting more pressure on a system already suffering from a high load.
- Another sign that the backend might be having problems is an increase in the otelcol_exporter_send_failed_spans metric
- this indicates that sending data to the backend failed permanently.
- Scaling up the Collector will likely only worsen the situation when this is consistently happening.
How to Scale
- At this point, we know which parts of our pipeline needs scaling.
- Regarding scaling, we have three types of components: stateless, scrapers, and stateful.
- Most Collector components are stateless.
- Even if they hold some state in memory, it isn’t relevant for scaling purposes.
- Scrapers, like the Prometheus receiver, are configured to obtain telemetry data from external locations.
- The receiver will then scrape target by target, putting data into the pipeline.
- Components like the tail sampling processor cannot be easily scaled, as they keep some relevant state in memory for their business.
- Those components require some careful consideration before being scaled up.
Scaling Stateless Collectors
mode: sidecar
- The good news is that most of the time, scaling the Collector is easy
- as it’s just a matter of adding new replicas and using an off-the-shelf load balancer.
- When gRPC is used to receive the data, we recommend using a load-balancer that understands gRPC.
- Otherwise, clients will always hit the same backing Collector.
- You should still consider splitting your collection pipeline with reliability in mind.
- For instance, when your workloads run on Kubernetes
- you might want to use DaemonSets to have a Collector on the same physical node as your workloads
- and a remote central Collector responsible for pre-processing the data before sending the data to the storage.
- When the number of nodes is low and the number of pods is high, Sidecars might make more sense
- as you’ll get a better load balancing for the gRPC connections among Collector layers without needing a gRPC-specific load balancer.
- Using a Sidecar also makes sense to avoid bringing down a crucial component for all pods in a node when one DaemonSet pod fails.
- For instance, when your workloads run on Kubernetes
- The sidecar pattern consists in adding a container into the workload pod. The OpenTelemetry Operator can automatically add that for you.
- you’ll need an OpenTelemetry Collector CR and you’ll need to annotate your PodSpec or Pod telling the operator to inject a sidecar:
1 |
|
In case you prefer to bypass the operator and add a sidecar manually, here’s an example:
1 | apiVersion: v1 |
Scaling the Scrapers
mode: statefulset
- Some receivers are actively obtaining telemetry data to place in the pipeline, like the hostmetrics and prometheus receivers.
- While getting host metrics isn’t something we’d typically scale up
- we might need to split the job of scraping thousands of endpoints for the Prometheus receiver.
- And we can’t simply add more instances with the same configuration
- as each Collector would try to scrape the same endpoints as every other Collector in the cluster
- causing even more problems, like out-of-order samples.
- The solution is to shard the endpoints by Collector instances so that if we add another replica of the Collector
- each one will act on a different set of endpoints.
- One way of doing that is by having one configuration file for each Collector
- so that each Collector would discover only the relevant endpoints for that Collector.
- For instance, each Collector could be responsible for one Kubernetes namespace or specific labels on the workloads.
- Another way of scaling the Prometheus receiver is to use the Target Allocator:
- it’s an extra binary that can be deployed as part of the OpenTelemetry Operator
- and will distribute Prometheus scrape targets for a given configuration across the cluster of Collectors.
- You can use a Custom Resource (CR) like the following to make use of the Target Allocator:
1 | apiVersion: opentelemetry.io/v1alpha1 |
After the reconciliation, the OpenTelemetry Operator will convert the Collector’s configuration into the following:
1 | exporters: |
- Note how the Operator added a global section and a new http_sd_configs to the otel-collector scrape config
- pointing to a Target Allocator instance it provisioned.
- Now, to scale the collectors, change the “replicas” attribute of the CR
- and the Target Allocator will distribute the load accordingly by providing a custom http_sd_config per collector instance (pod).
Scaling Stateful Collectors
- Certain components might hold data in memory, yielding different results when scaled up.
- It is the case for the tail-sampling processor
- which holds spans in memory for a given period, evaluating the sampling decision only when the trace is considered complete.
- Scaling a Collector cluster by adding more replicas means that different collectors will receive spans for a given trace
- causing each collector to evaluate whether that trace should be sampled, potentially coming to different answers.
- This behavior results in traces missing spans, misrepresenting what happened in that transaction.
- A similar situation happens when using the span-to-metrics processor to generate service metrics.
- When different collectors receive data related to the same service, aggregations based on the service name will be inaccurate.
- To overcome this, you can deploy a layer of Collectors containing the load-balancing exporter
- in front of your Collectors doing the tail-sampling or the span-to-metrics processing.
- The load-balancing exporter will hash the trace ID or the service name consistently
- and determine which collector backend should receive spans for that trace.
- You can configure the load-balancing exporter to use the list of hosts behind a given DNS A entry, such as a Kubernetes headless service.
- When the deployment backing that service is scaled up or down, the load-balancing exporter will eventually see the updated list of hosts.
- Alternatively, you can specify a list of static hosts to be used by the load-balancing exporter.
- You can scale up the layer of Collectors configured with the load-balancing exporter by increasing the number of replicas.
- Note that each Collector will potentially run the DNS query at different times, causing a difference in the cluster view for a few moments.
- We recommend lowering the interval value so that the cluster view is different only for a short period in highly-elastic environments.
- using a DNS A record (Kubernetes service otelcol on the observability namespace) as the input for the backend information:
1 | receivers: |
Transforming telemetry
- The OpenTelemetry Collector is a convenient place to transform data before sending it to a vendor or other systems.
- This is frequently done for data quality, governance, cost, and security reasons.
- Processors available from the Collector Contrib repository support dozens of different transformations on metric, span and log data.
- The configuration of processors, particularly advanced transformations, may have a significant impact on collector performance.
Basic filtering
Processor: filter processor
- The filter processor allows users to filter telemetry using OTTL. - OpenTelemetry Transformation Language
- Telemetry that matches any condition is dropped.
For example, to only allow span data from services app1, app2, and app3 and drop data from all other services:
1 | processors: |
To only drop spans from a service called service1 while keeping all other spans:
1 | processors: |
Adding or Deleting Attributes
Processor: attributes processor or resource processor
- The attributes processor can be used to update, insert, delete, or replace existing attributes on metrics or traces.
- For example, here’s a configuration that adds an attribute called account_id to all spans:
1 | processors: |
- The resource processor has an identical configuration, but applies only to resource attributes.
- Use the resource processor to modify infrastructure metadata related to telemetry.
- For example, this inserts the Kubernetes cluster name:
1 | processors: |
Renaming Metrics or Metric Labels
Processor: metrics transform processor
- The metrics transform processor shares some functionality with the attributes processor
- but also supports renaming and other metric-specific functionality.
1 | processors: |
- The metrics transform processor also supports regular expressions
- to apply transform rules to multiple metric names or metric labels at the same time.
- This example renames cluster_name to cluster-name for all metrics:
1 | processors: |
Enriching Telemetry with Resource Attributes
Processor: resource detection processor and k8sattributes processor
- These processors can be used for enriching telemetry with relevant infrastructure metadata
- to help teams quickly identify when underlying infrastructure is impacting service health or performance.
- The resource detection processor adds relevant cloud or host-level information to telemetry:
1 | processors: |
- Similarly, the K8s processor enriches telemetry with relevant Kubernetes metadata like pod name, node name, or workload name.
- The collector pod must be configured to have read access to certain Kubernetes RBAC APIs
- To use the default options, it can be configured with an empty block:
1 | processors: |
Setting a span status
Processor: transform processor
- Use the transform processor to set a span’s status.
- You can also use the transform processor to modify the span name based on its attributes or extract span attributes from the span name.
- The following example sets the span status to Ok when the http.request.status_code attribute is 400:
1 | transform: |
Advanced Transformations
- More advanced attribute transformations are also available in the transform processor.
- The transform processor allows end-users
- to specify transformations on metrics, logs, and traces using the OpenTelemetry Transformation Language.
Architecture
- The OpenTelemetry Collector is an executable file
- that can receive telemetry, process it, and export it to multiple targets, such as observability backends.
- The Collector supports several popular open source protocols for receiving and sending telemetry data
- and it offers an extensible architecture for adding more protocols.
- Data receiving, processing, and exporting are done using pipelines. You can configure the Collector to have one or more pipelines.
- Each pipeline includes the following:
- A set of receivers that collect the data.
- A series of optional processors that get the data from receivers and process it.
- A set of exporters which get the data from processors and send it outside the Collector.
- The same receiver can be included in multiple pipelines and multiple pipelines can include the same exporter.
Pipelines
- A pipeline defines a path that data follows in the Collector: from reception, to processing (or modification), and finally to export.
- Pipelines can operate on three telemetry data types: traces, metrics, and logs.
- The data type is a property of the pipeline defined by its configuration.
- Receivers, processors, and exporters used in a pipeline must support the particular data type
- otherwise the pipeline.ErrSignalNotSupported exception is reported when the configuration loads.
The following diagram represents a typical pipeline:
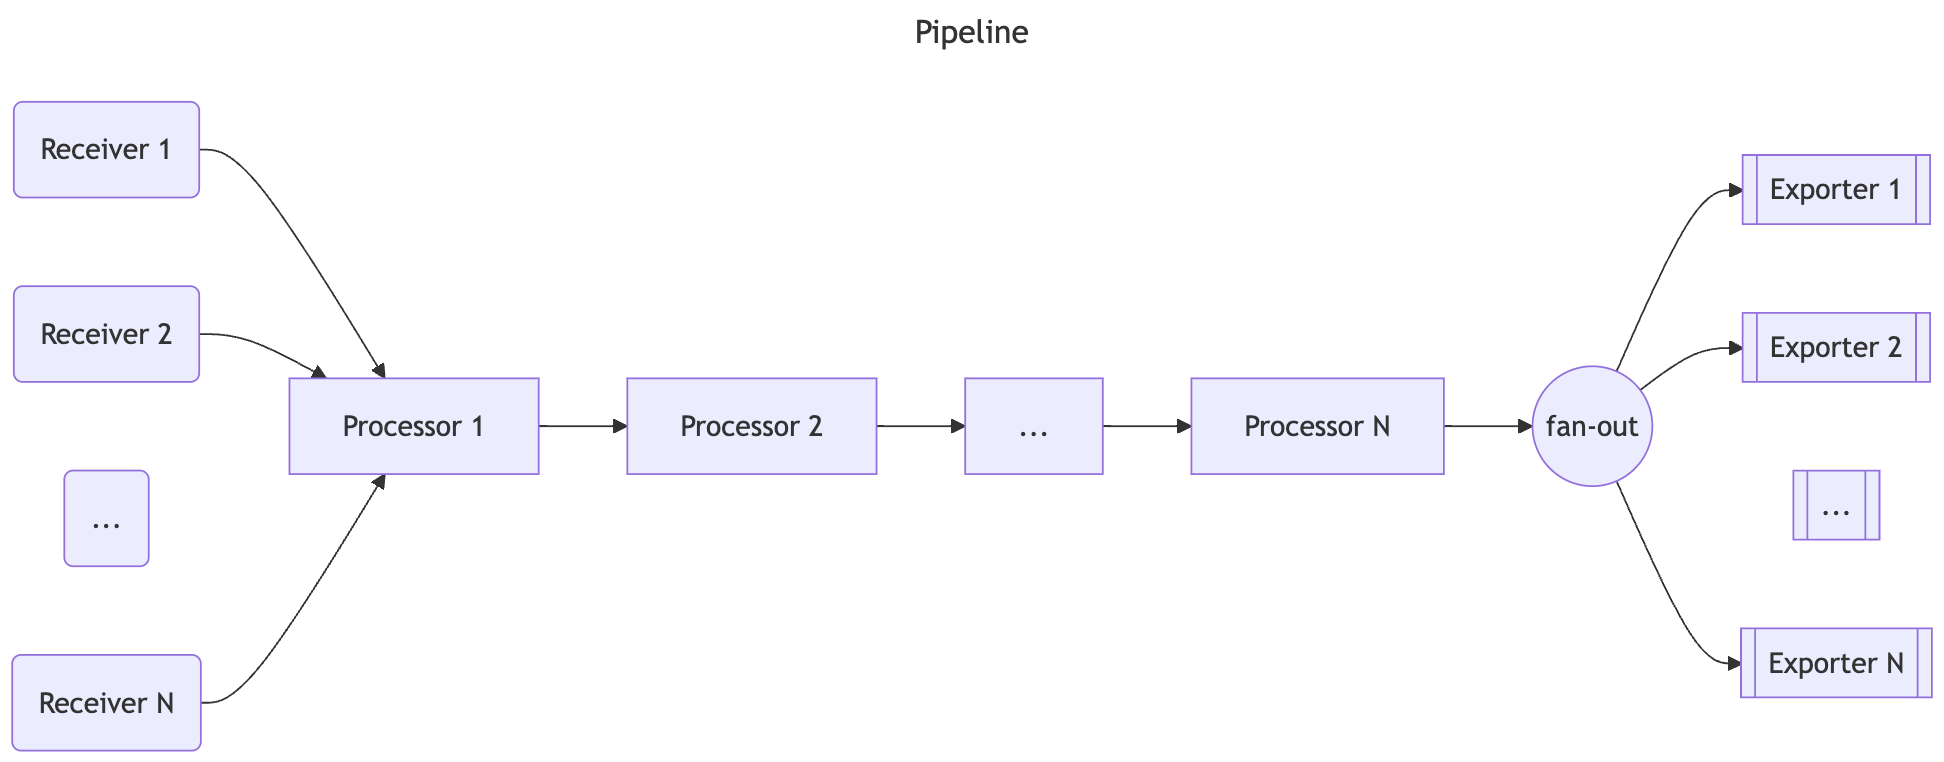
- Pipelines can have one or more receivers.
- Data from all receivers is pushed to the first processor, which processes the data and then pushes it to the next processor.
- A processor might also drop the data if it’s sampling or filtering.
- This continues until the last processor in the pipeline pushes the data to the exporters.
- Each exporter gets a copy of each data element.
- The last processor uses a fanoutconsumer to send the data to multiple exporters.
- The pipeline is constructed during Collector startup based on pipeline definition in the configuration.
A pipeline configuration typically looks like this:
1 | service: |
Receivers
- Receivers typically listen on a network port and receive telemetry data.
- They can also actively obtain data, like scrapers.
- Usually one receiver is configured to send received data to one pipeline.
- However, it is also possible to configure the same receiver to send the same received data to multiple pipelines.
- This can be done by listing the same receiver in the receivers key of several pipelines:
- The configuration uses composite key names in the form of type[/name].
otlp receiver will send the same data to pipeline traces and to pipeline traces/2
1 | receivers: |
When the Collector loads this config, the result looks like this diagram (part of processors and exporters are omitted for brevity):
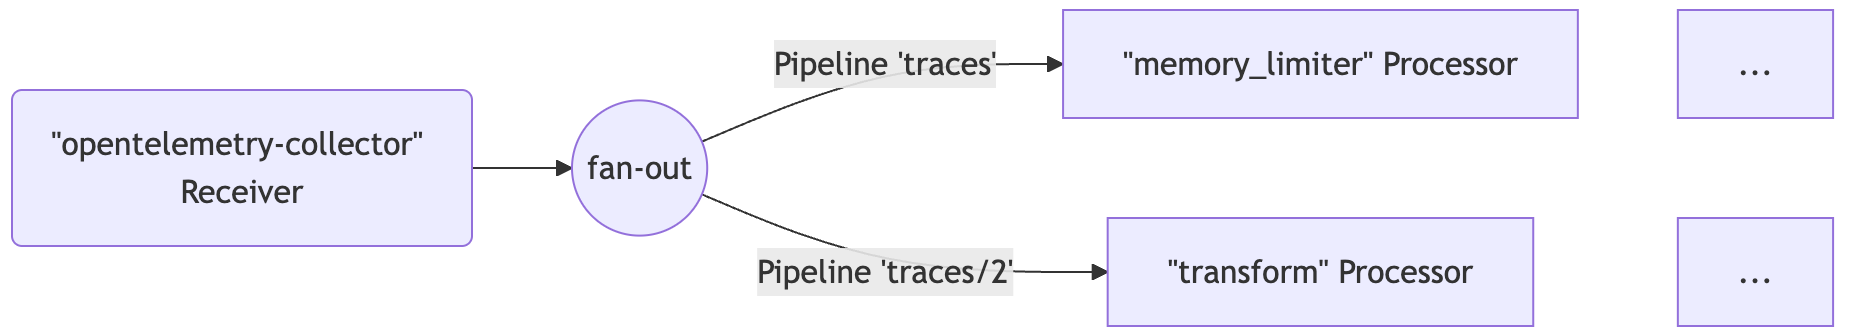
- When the same receiver is referenced in more than one pipeline
- the Collector creates only one receiver instance at runtime that sends the data to a fan-out consumer.
- The fan-out consumer in turn sends the data to the first processor of each pipeline.
- The data propagation from receiver to the fan-out consumer and then to processors is completed using a synchronous function call.
- This means that if one processor blocks the call, the other pipelines attached to this receiver are blocked from receiving the same data
- and the receiver itself stops processing and forwarding newly received data.
Exporters
- Exporters typically forward the data they get to a destination on a network, but they can also send the data elsewhere.
- For example, debug exporter writes the telemetry data to the logging destination.
- The configuration allows for multiple exporters of the same type, even in the same pipeline.
- For example, you can have two otlp exporters defined, each one sending to a different OTLP endpoint:
1 | exporters: |
An exporter usually gets the data from one pipeline. However, you can configure multiple pipelines to send data to the same exporter:
1 | exporters: |
- In the above example, otlp exporter gets data from pipeline traces and from pipeline traces/2.
- When the Collector loads this config, the result looks like this diagram (part of processors and receivers are omitted for brevity):
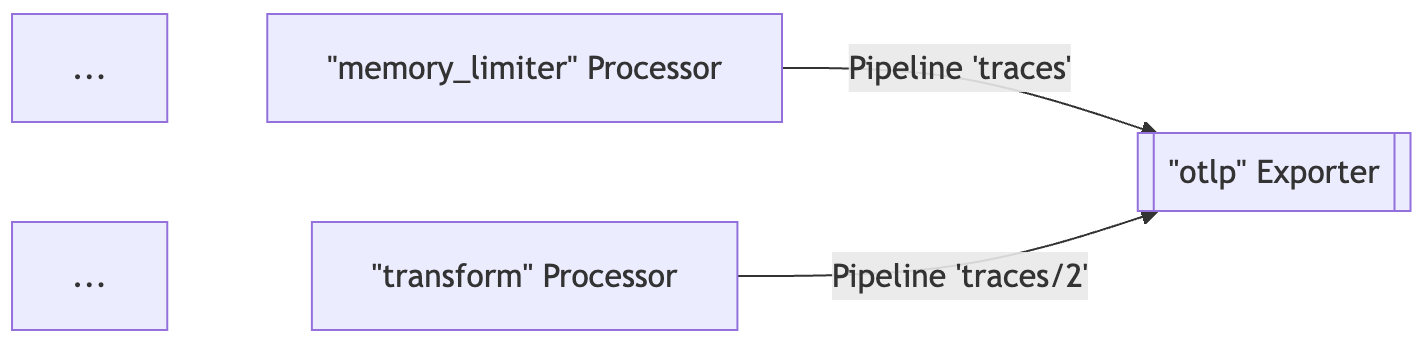
Processors
- A pipeline can contain sequentially connected processors.
- The first processor gets the data from one or more receivers that are configured for the pipeline
- and the last processor sends the data to one or more exporters that are configured for the pipeline.
- All processors between the first and last receive the data from only one preceding processor and send data to only one succeeding processor.
- Processors can transform the data before forwarding it, such as adding or removing attributes from spans.
- They can also drop the data by deciding not to forward it (for example, the probabilisticsampler processor).
- Or they can generate new data.
- The same name of the processor can be referenced in the processors key of multiple pipelines.
- In this case, the same configuration is used for each of these processors, but each pipeline always gets its own instance of the processor.
- Each of these processors has its own state, and the processors are never shared between pipelines.
- For example, if batch processor is used in several pipelines
- each pipeline has its own batch processor
- but each batch processor is configured exactly the same way if they reference the same key in the configuration.
See the following configuration:
1 | processors: |
When the Collector loads this config, the result looks like this diagram:
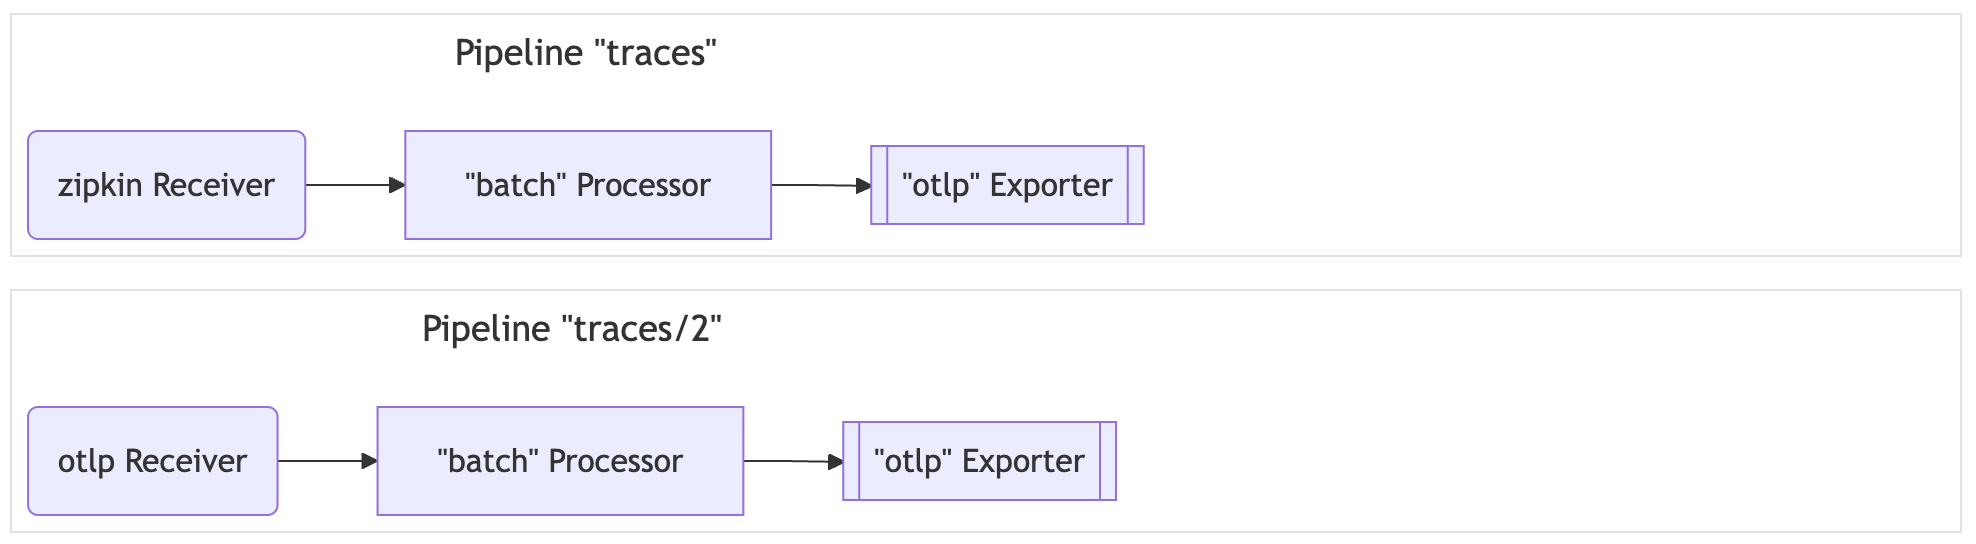
- Note that each batch processor is an independent instance, although they are configured the same way with a send_batch_size of 10000.
- The same name of the processor must not be referenced multiple times in the processors key of a single pipeline.
Running as an agent
- On a typical VM/container, user applications are running in some processes/pods with an OpenTelemetry library.
- Previously, the library did all the recording, collecting, sampling, and aggregation of traces, metrics, and logs
- and then either exported the data to other persistent storage backends through the library exporters, or displayed it on local zpages.
- This pattern has several drawbacks, for example:
- For each OpenTelemetry library, exporters and zpages must be re-implemented in native languages.
- In some programming languages (for example, Ruby or PHP), it is difficult to do the stats aggregation in process.
- To enable exporting of OpenTelemetry spans, stats, or metrics
- application users need to manually add library exporters and redeploy their binaries.
- This is especially difficult when an incident has occurred, and users want to use OpenTelemetry to investigate the issue right away.
- Application users need to take the responsibility for configuring and initializing exporters.
- These tasks are error-prone (for example, setting up incorrect credentials or monitored resources)
- and users may be reluctant to “pollute” their code with OpenTelemetry.
- To resolve the issues above, you can run OpenTelemetry Collector as an agent.
- The agent runs as a daemon in the VM/container and can be deployed independent of the library.
- it should be able to retrieve traces, metrics, and logs from the library, and export them to other backends.
- We may also give the agent the ability to push configurations (such as sampling probability) to the library.
- For those languages that cannot do stats aggregation in process, they can send raw measurements and have the agent do the aggregation.
- For developers and maintainers of other libraries:
- By adding specific receivers, you can configure an agent to accept traces, metrics, and logs from other tracing/monitoring libraries, such as Zipkin, Prometheus, etc.
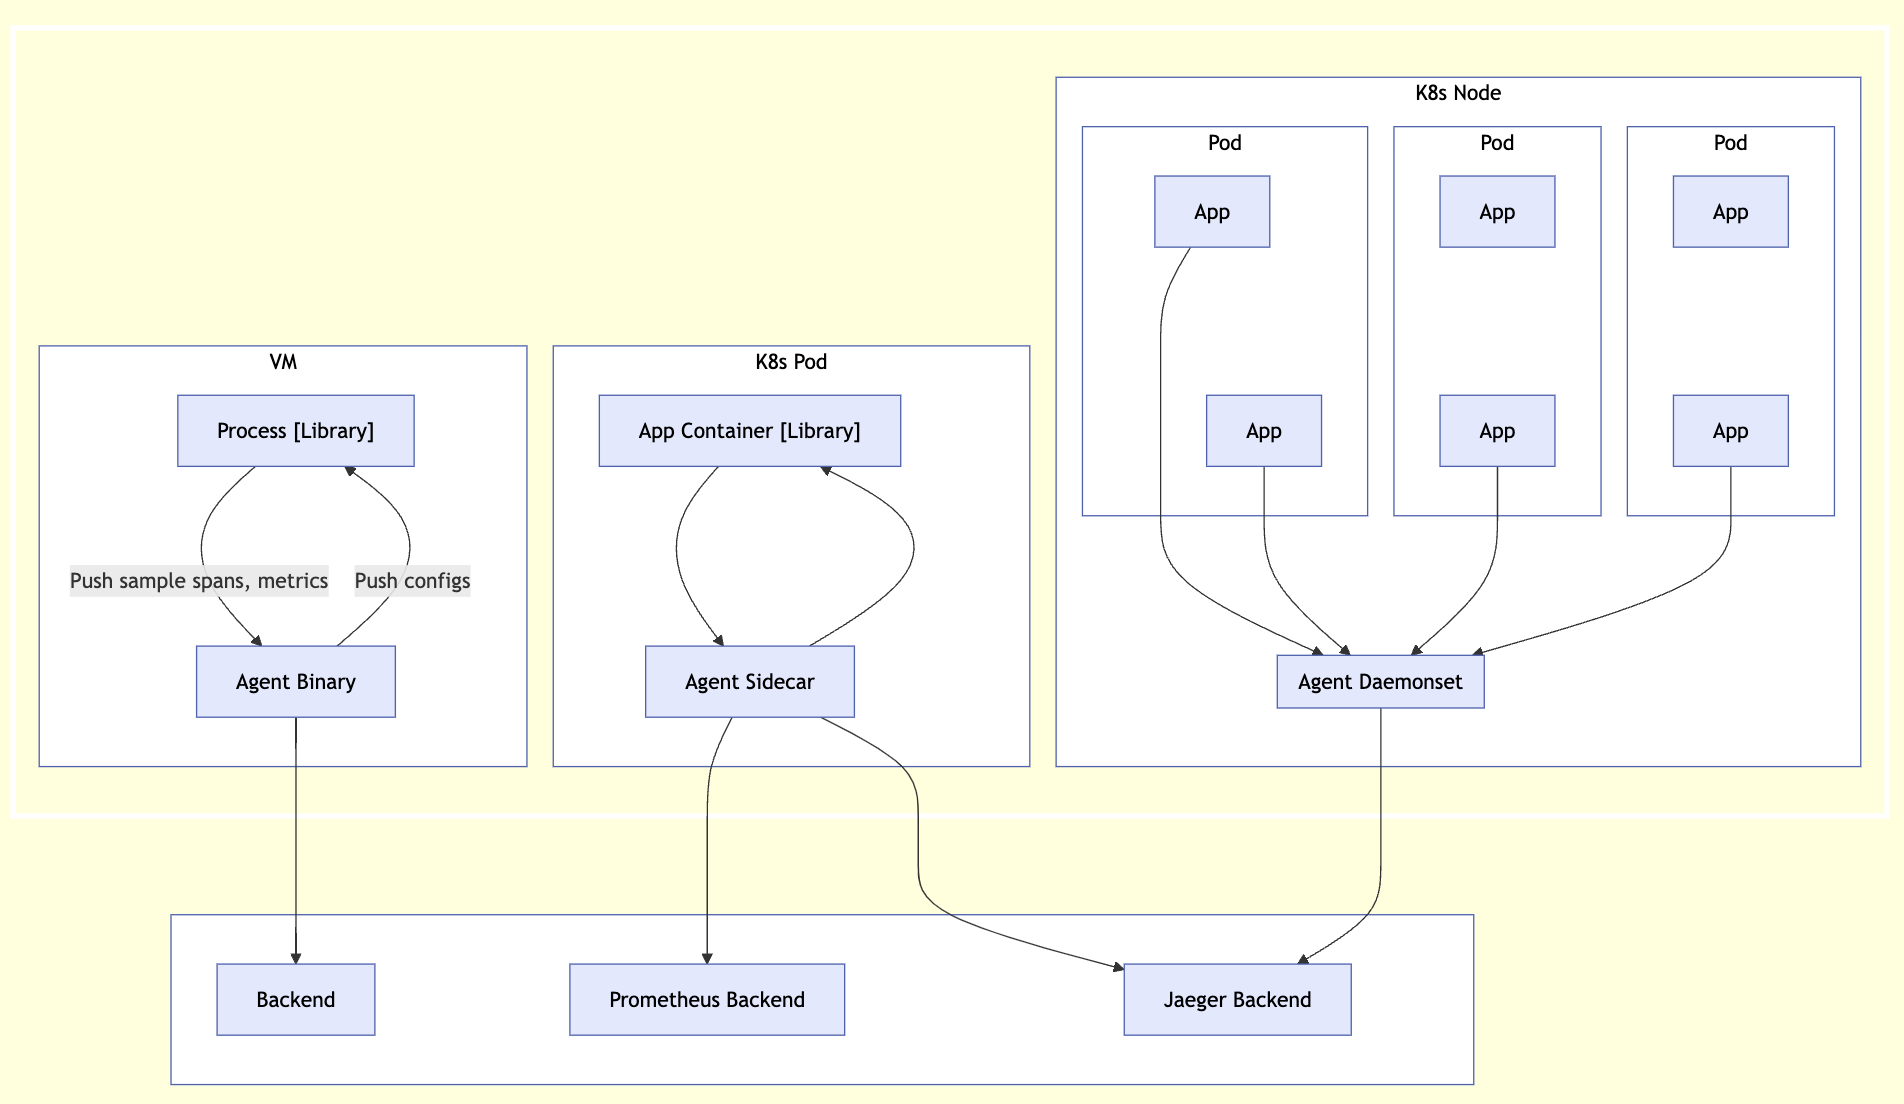
Running as a gateway
- The OpenTelemetry Collector can run as a gateway instance
- and receive spans and metrics exported by one or more agents or libraries or by tasks/agents that emit in one of the supported protocols.
- The Collector is configured to send data to the configured exporter(s).
- The OpenTelemetry Collector can also be deployed in other configurations
- such as receiving data from other agents or clients in one of the formats supported by its receivers.
The following figure summarizes the deployment architecture:
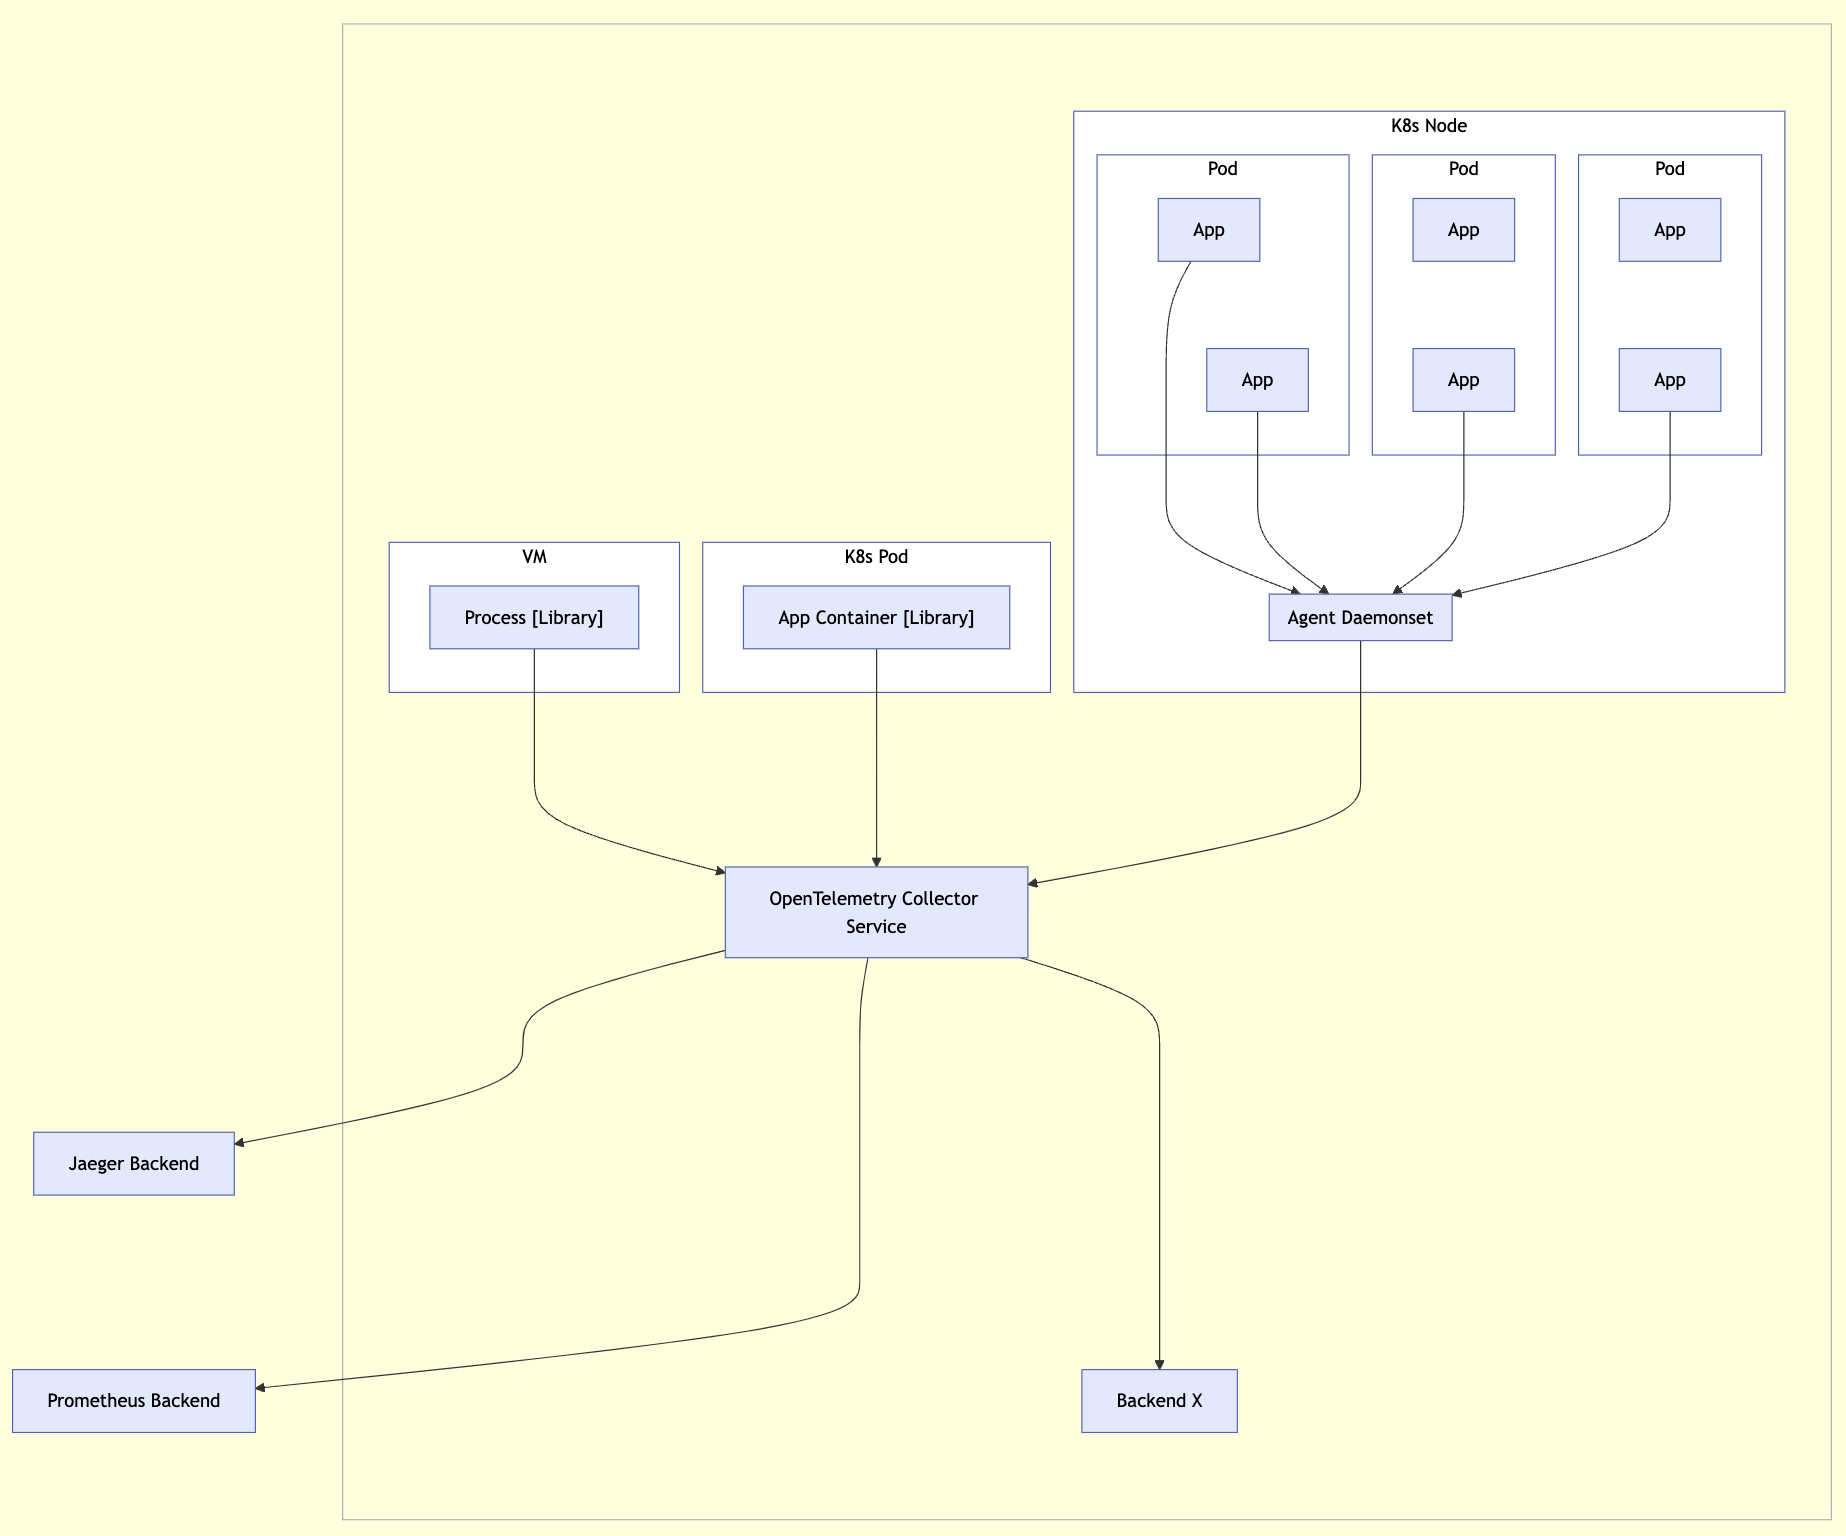
Platforms
OpenTelemetry is available for a variety of platforms and environments, ensuring seamless observability in hybrid systems.
FaaS
OpenTelemetry supports various methods of monitoring Function-as-a-Service provided by different cloud vendors
- Functions as a Service (FaaS) is an important serverless compute platform for cloud native apps.
- these applications have slightly different monitoring guidance and requirements than applications running on Kubernetes or Virtual Machines.
- The initial vendor scope of the FaaS documentation is around Microsoft Azure, Google Cloud Platform (GCP), and Amazon Web Services (AWS).
- AWS functions are also known as Lambda.
- Community Assets
- The OpenTelemetry community currently provides pre-built Lambda layers able to auto-instrument your application
- as well as the option of a standalone Collector Lambda layer that can be used when instrumenting applications manually or automatically.
| Key | Desc |
|---|---|
| Lambda Auto-Instrumentation | Automatically instrument your Lambdas with OpenTelemetry |
| Lambda Collector Configuration | Add and configure the Collector Lambda layer to your Lambda |
| Lambda Manual Instrumentation | Manually instrument your Lambdas with OpenTelemetry |
Kubernetes
- Kubernetes is an open source system for automated deployment, scaling, and management of containerized applications.
- It has become a widely-adopted, industry tool, leading to an increased need for observability tooling.
- In response, OpenTelemetry has created many different tools to help Kubernetes users observe their clusters and services.
Getting Started
- This page will walk you through the fastest way to get started monitoring your Kubernetes cluster using OpenTelemetry.
- It will focus on collecting metrics and logs for Kubernetes clusters, nodes, pods, and containers
- as well as enabling the cluster to support services emitting OTLP data.
- If you’re looking to see OpenTelemetry in action with Kubernetes, the best place to start is the OpenTelemetry Demo.
- The demo is intended to illustrate the implementation of OpenTelemetry
- but it is not intended to be an example of how to monitor Kubernetes itself.
- Once you finish with this walkthrough, it can be a fun experiment to install the demo and see how all the monitoring responds to an active workload.
- The demo is intended to illustrate the implementation of OpenTelemetry
- If you’re looking to start migrating from Prometheus to OpenTelemetry
- or if you’re interested in using the OpenTelemetry Collector to collect Prometheus metrics, see Prometheus Receiver.
Overview
- Kubernetes exposes a lot of important telemetry in many different ways.
- It has logs, events, metrics for many different objects, and the data generated by its workloads.
- To collect all of this data we’ll use the OpenTelemetry Collector.
- The collector has many different tools at its disposal which allow it to efficiently collect all this data and enhance it in meaningful ways.
- To collect all the data, we’ll need two installations of the collector, one as a Daemonset and one as a Deployment.
- The Daemonset installation of the collector will be used to collect telemetry emitted by services, logs, and metrics for nodes, pods, and containers.
- The Deployment installation of the collector will be used to collect metrics for the cluster and events.
- To install the collector, we’ll use the OpenTelemetry Collector Helm chart
- which comes with a few configuration options that will make configure the collector easier.
- If you’re interested in using a Kubernetes operator, see OpenTelemetry Operator, but this guide will focus on the Helm chart.
Preparation
Assuming you already have Helm installed, add the OpenTelemetry Collector Helm chart so it can be installed later.
1 | helm repo add open-telemetry https://open-telemetry.github.io/opentelemetry-helm-charts |
Daemonset Collector
- The first step to collecting Kubernetes telemetry is to deploy a daemonset instance of the OpenTelemetry Collector
- to gather telemetry related to nodes and workloads running on those node.
- A daemonset is used to guarantee that this instance of the collector is installed on all nodes.
- Each instance of the collector in the daemonset will collect data only from the node on which it is running.
This instance of the collector will use the following components:
| Component | Desc |
|---|---|
| OTLP Receiver | to collect application traces, metrics and logs. |
| Kubernetes Attributes Processor | to add Kubernetes metadata to incoming application telemetry. |
| Kubeletstats Receiver | to pull node, pod, and container metrics from the API server on a kubelet. |
| Filelog Receiver | to collect Kubernetes logs and application logs written to stdout/stderr. |
OTLP Receiver
- The OTLP Receiver is the best solution for collecting traces, metrics, and logs in the OTLP format.
- If you are emitting application telemetry in another format, there is a good chance that the Collector has a receiver for it
- but for this tutorial we’ll assume the telemetry is formatted in OTLP.
- Although not a requirement
- it is a common practice for applications running on a node to emit their traces, metrics, and logs to a collector running on the same node.
- This keeps network interactions simple and allows easy correlation of Kubernetes metadata using the k8sattributes processor.
Kubernetes Attributes Processor
- The Kubernetes Attributes Processor is a highly recommended component in any collector receive telemetry from Kubernetes pods.
- This processor automatically discovers Kubernetes pods
- extracts their metadata such as pod name or node name, and adds the extracted metadata to spans, metrics, and logs as resource attributes.
- Because it adds Kubernetes context to your telemetry
- the Kubernetes Attributes Processor lets you correlate your application’s traces, metrics, and logs signals with your Kubernetes telemetry
- such as pod metrics and traces.
Kubeletstats Receiver
- The Kubeletstats Receiver is the receiver that gathers metrics about the node.
- It will gather metrics like container memory usage, pod cpu usage, and node network errors.
- All of the telemetry includes Kubernetes metadata like pod name or node name.
- Since we’re using the Kubernetes Attributes Processor
- we’ll be able to correlate our application traces, metrics, and logs with the metrics produced by the Kubeletstats Receiver.
Filelog Receiver
- The Filelog Receiver will collect logs written to stdout/stderr by tailing the logs Kubernetes writes to
/var/log/pods/*/*/*.log. - Like most log tailers, the filelog receiver provides a robust set of actions that allow you to parse the file however you need.
- Someday you may need to configure a Filelog Receiver on your own
- but for this walkthrough the OpenTelemetry Helm Chart will handle all the complex configuration for you.
- In addition, it will extract useful Kubernetes metadata based on the file name.
- Since we’re using the Kubernetes Attributes Processor
- we’ll be able to correlate the application traces, metrics, and logs with the logs produced by the Filelog Receiver.
- The OpenTelemetry Collector Helm chart makes configuring all of these components in a daemonset installation of the collector easy.
- It will also take care of all of the Kubernetes-specific details, such as RBAC, mounts and host ports.
- One caveat - the chart doesn’t send the data to any backend by default.
- If you want to actually use your data in your favorite backend you’ll need to configure an exporter yourself.
The following values.yaml is what we’ll use - mode: daemonset
1 | mode: daemonset |
To use this values.yaml with the chart, save it to your preferred file location and then run the following command to install the chart
1 | helm install otel-collector open-telemetry/opentelemetry-collector --values <path where you saved the chart> |
You should now have a daemonset installation of the OpenTelemetry Collector running in your cluster collecting telemetry from each node!
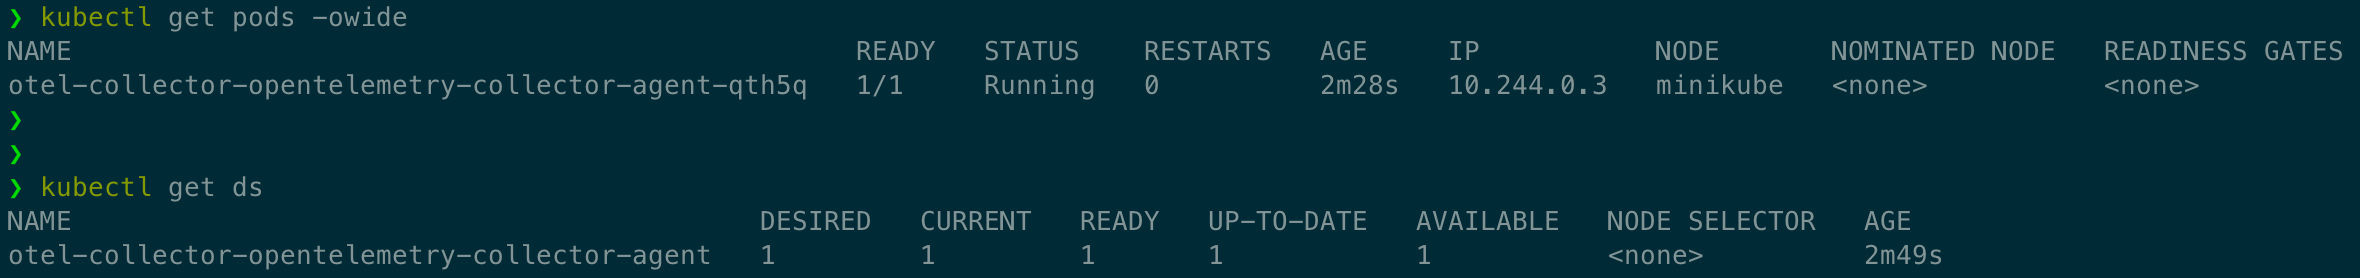
Deployment Collector
- The next step to collecting Kubernetes telemetry
- is to deploy a deployment instance of the Collector to gather telemetry related to the cluster as a whole.
- A deployment with exactly one replica ensures that we don’t produce duplicate data.
This instance of the Collector will use the following components:
| Components | Desc |
|---|---|
| Kubernetes Cluster Receiver | to collect cluster-level metrics and entity events. |
| Kubernetes Objects Receiver | to collect objects, such as events, from the Kubernetes API server. |
Kubernetes Cluster Receiver
- The Kubernetes Cluster Receiver is the Collector’s solution for collecting metrics about the state of the cluster as a whole.
- This receiver can gather metrics about node conditions, pod phases, container restarts, available and desired deployments, and more.
Kubernetes Objects Receiver
- The Kubernetes Objects Receiver is the Collector’s solution for collecting Kubernetes objects as logs.
- Although any object can be collected, a common and important use case is to collect Kubernetes events.
- The OpenTelemetry Collector Helm chart streamlines the configuration for all of these components in a deployment installation of the Collector.
- It will also take care of all of the Kubernetes-specific details, such as RBAC and mounts.
- One caveat - the chart doesn’t send the data to any backend by default.
- If you want to actually use your data in your preferred backend, you’ll need to configure an exporter yourself.
The following values.yaml is what we’ll use:
1 | mode: deployment |
To use this values.yaml with the chart, save it to your preferred file location and then run the following command to install the chart:
You should now have a deployment installation of the collector running in your cluster that collects cluster metrics and events!
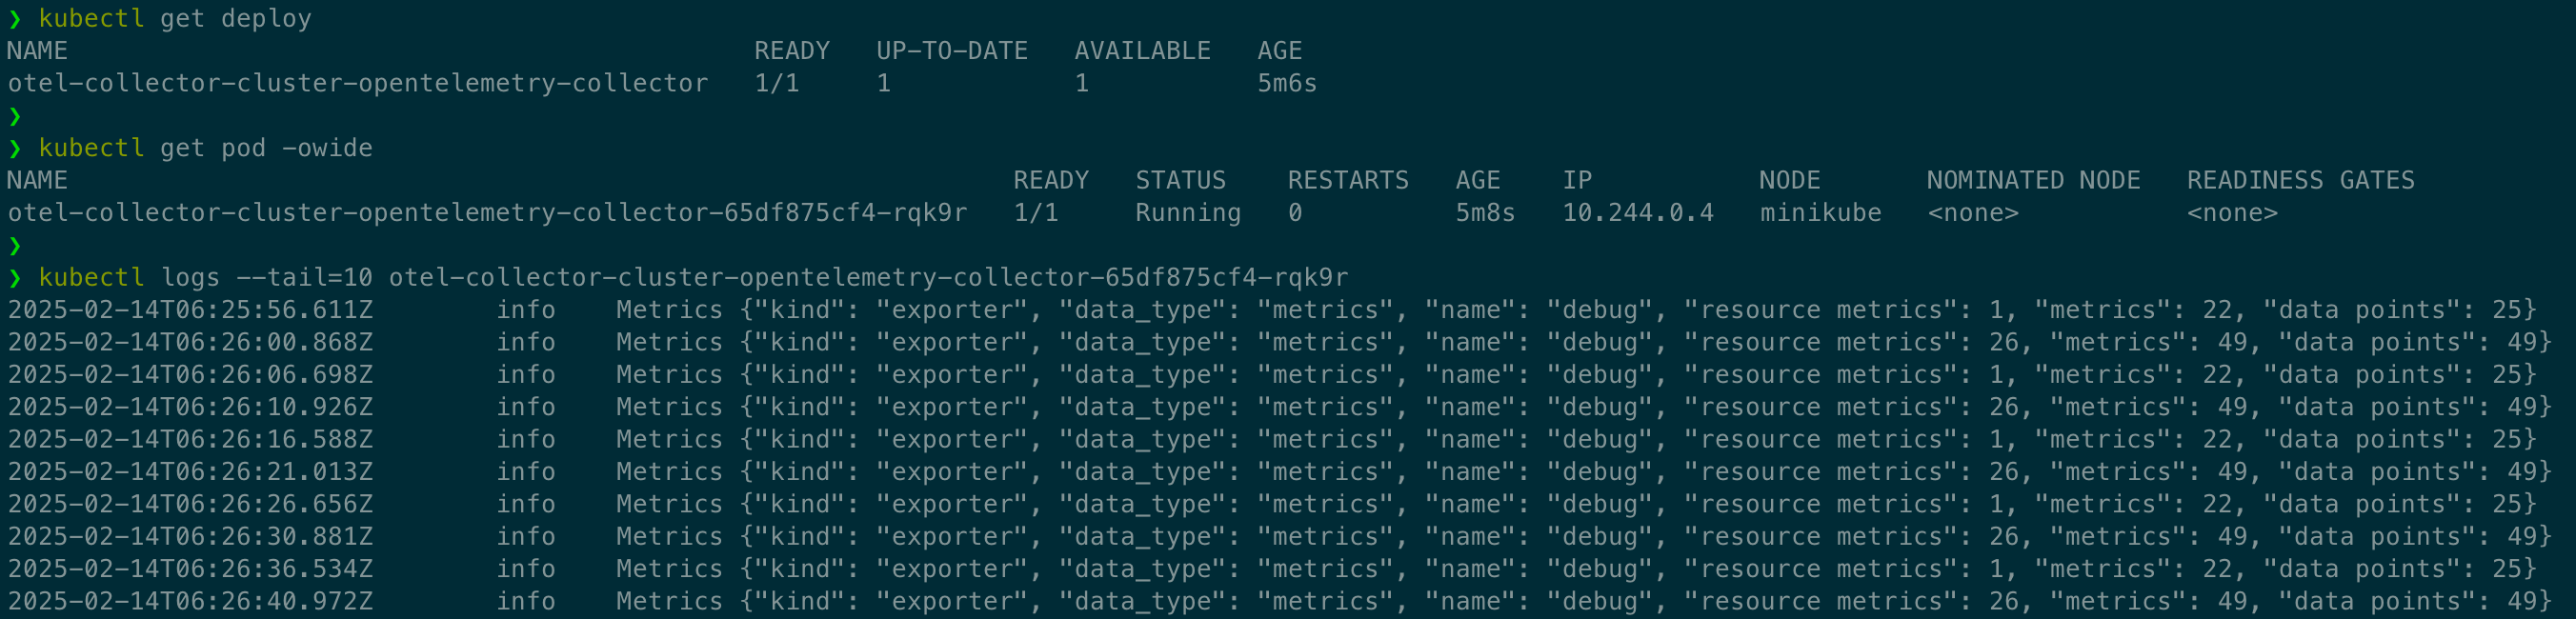
Collector
- The OpenTelemetry Collector is a vendor-agnostic way to receive, process and export telemetry data.
- Although the Collector can be used many places
- this documentation will focus on how to use the Collector to monitor Kubernetes and the services running on Kubernetes.
Components
- The OpenTelemetry Collector supports many different receivers and processors to facilitate monitoring Kubernetes.
- This section covers the components that are most important for collecting Kubernetes data and enhancing it.
- For application traces, metrics, or logs, we recommend the OTLP receiver, but any receiver that fits your data is appropriate.
| Components | Pattern | Desc |
|---|---|---|
| Kubernetes Attributes Processor | DaemonSet / Deployment | adds Kubernetes metadata to incoming application telemetry. |
| Kubeletstats Receiver | DaemonSet / Deployment | pulls node, pod, and container metrics from the API server on a kubelet. |
| Filelog Receiver | DaemonSet / Deployment / Sidecar | collects Kubernetes logs and application logs written to stdout/stderr. |
| Kubernetes Cluster Receiver | DaemonSet / Deployment | collects cluster-level metrics and entity events. |
| Kubernetes Objects Receiver | DaemonSet / Deployment | collects objects, such as events, from the Kubernetes API server. |
| Prometheus Receiver | DaemonSet / Deployment | receives metrics in Prometheus format. |
| Host Metrics Receiver | DaemonSet / Deployment | scrapes host metrics from Kubernetes nodes. |
Kubernetes Attributes Processor
| Deployment Pattern | Usable |
|---|---|
| DaemonSet (agent) | Yes |
| Deployment (gateway) | Yes |
| Sidecar | No |
- The Kubernetes Attributes Processor automatically discovers Kubernetes pods
- extracts their metadata, and adds the extracted metadata to spans, metrics, and logs as resource attributes.
- The Kubernetes Attributes Processor is one of the most important components for a collector running in Kubernetes.
- Any collector receiving application data should use it.
- Because it adds Kubernetes context to your telemetry
- the Kubernetes Attributes Processor lets you correlate your application’s traces, metrics, and logs signals with your Kubernetes telemetry
- such as pod metrics and traces.
- The Kubernetes Attributes Processor uses the Kubernetes API to discover all pods running in a cluster
- and keeps a record of their IP addresses, pod UIDs, and interesting metadata.
- By default, data passing through the processor is associated to a pod via the incoming request’s IP address, but different rules can be configured.
- Since the processor uses the Kubernetes API, it requires special permissions (see example below).
- If you’re using the OpenTelemetry Collector Helm chart you can use the kubernetesAttributes preset to get started.
- The following attributes are added by default:
- k8s.namespace.name
- k8s.pod.name
- k8s.pod.uid
- k8s.pod.start_time
- k8s.deployment.name
- k8s.node.name
- The Kubernetes Attributes Processor can also set custom resource attributes for traces, metrics, and logs
- using the Kubernetes labels and Kubernetes annotations you’ve added to your pods and namespaces.
1 | k8sattributes: |
- There are also special configuration options for when the collector is deployed
- as a Kubernetes DaemonSet (agent) or as a Kubernetes Deployment (gateway).
- Since the processor uses the Kubernetes API, it needs the correct permission to work correctly.
- For most use cases, you should give the service account running the collector the following permissions via a ClusterRole.
1 | apiVersion: v1 |
Kubeletstats Receiver
| Deployment Pattern | Usable |
|---|---|
| DaemonSet (agent) | Preferred |
| Deployment (gateway) | Yes, but will only collect metrics from the node it is deployed on |
| Sidecar | No |
- Each Kubernetes node runs a kubelet that includes an API server.
- The Kubernetes Receiver connects to that kubelet via the API server
- to collect metrics about the node and the workloads running on the node.
- There are different methods for authentication, but typically a service account is used.
- The service account will also need proper permissions to pull data from the Kubelet (see below).
- If you’re using the OpenTelemetry Collector Helm chart you can use the kubeletMetrics preset to get started.
- By default, metrics will be collected for pods and nodes, but you can configure the receiver to collect container and volume metrics as well.
- The receiver also allows configuring how often the metrics are collected:
1 | receivers: |
- Since the processor uses the Kubernetes API, it needs the correct permission to work correctly.
- For most use cases, you should give the service account running the Collector the following permissions via a ClusterRole.
1 |
|
Filelog Receiver
| Deployment Pattern | Usable |
|---|---|
| DaemonSet (agent) | Preferred |
| Deployment (gateway) | Yes, but will only collect logs from the node it is deployed on |
| Sidecar | Yes, but this would be considered advanced configuration |
- The Filelog Receiver tails and parses logs from files.
- Although it’s not a Kubernetes-specific receiver, it is still the de facto solution for collecting any logs from Kubernetes.
- The Filelog Receiver is composed of Operators that are chained together to process a log.
- Each Operator performs a simple responsibility, such as parsing a timestamp or JSON.
- Configuring a Filelog Receiver is not trivial.
- If you’re using the OpenTelemetry Collector Helm chart you can use the logsCollection preset to get started.
Since Kubernetes logs normally fit a set of standard formats, a typical Filelog Receiver configuration for Kubernetes looks like:
1 | filelog: |
- In addition to the Filelog Receiver configuration, your OpenTelemetry Collector installation in Kubernetes will need access to the logs it wants to collect.
- Typically this means adding some volumes and volumeMounts to your collector manifest:
1 |
|
Kubernetes Cluster Receiver
| Deployment Pattern | Usable |
|---|---|
| DaemonSet (agent) | Yes, but will result in duplicate data |
| Deployment (gateway) | Yes, but more than one replica results in duplicate data |
| Sidecar | No |
- The Kubernetes Cluster Receiver collects metrics and entity events about the cluster as a whole using the Kubernetes API server.
- Use this receiver to answer questions about pod phases, node conditions, and other cluster-wide questions.
- Since the receiver gathers telemetry for the cluster as a whole
- only one instance of the receiver is needed across the cluster in order to collect all the data.
- There are different methods for authentication, but typically a service account is used.
- The service account also needs proper permissions to pull data from the Kubernetes API server (see below).
- If you’re using the OpenTelemetry Collector Helm chart you can use the clusterMetrics preset to get started.
- For node conditions, the receiver only collects Ready by default, but it can be configured to collect more.
- The receiver can also be configured to report a set of allocatable resources, such as cpu and memory:
1 | k8s_cluster: |
- Since the processor uses the Kubernetes API, it needs the correct permission to work correctly.
- For most use cases, you should give the service account running the Collector the following permissions via a ClusterRole.
1 |
|
Kubernetes Objects Receiver
| Deployment Pattern | Usable |
|---|---|
| DaemonSet (agent) | Yes, but will result in duplicate data |
| Deployment (gateway) | Yes, but more than one replica results in duplicate data |
| Sidecar | No |
- The Kubernetes Objects receiver collects, either by pulling or watching, objects from the Kubernetes API server.
- The most common use case for this receiver is watching Kubernetes events, but it can be used to collect any type of Kubernetes object.
- Since the receiver gathers telemetry for the cluster as a whole
- only one instance of the receiver is needed across the cluster in order to collect all the data.
- Currently only a service account can be used for authentication.
- The service account also needs proper permissions to pull data from the Kubernetes API server (see below).
- If you’re using the OpenTelemetry Collector Helm chart and you want to ingest events, you can use the kubernetesEvents preset to get started.
- For objects configuring for pulling, the receiver will use the Kubernetes API to periodically list all the objects in the Cluster.
- Each object will be converted to its own log.
- For objects configured for watching, the receiver creates a stream with the Kubernetes API and which receives updates as the objects change.
- To see which objects are available for collection run in your cluster run kubectl api-resources
- Since the processor uses the Kubernetes API, it needs the correct permission to work correctly.
- Since service accounts are the only authentication option you must give the service account the proper access.
1 |
|
Prometheus Receiver
| Deployment Pattern | Usable |
|---|---|
| DaemonSet (agent) | Yes |
| Deployment (gateway) | Yes |
| Sidecar | No |
- Prometheus is a common metrics format for both Kubernetes and services running on Kubernetes.
- The Prometheus receiver is a minimal drop-in replacement for the collection of those metrics.
- It supports the full set of Prometheus scrape_config options.
- There are a few advanced Prometheus features that the receiver does not support.
- The receiver returns an error if the configuration YAML/code contains any of the following:
- alert_config.alertmanagers
- alert_config.relabel_configs
- remote_read
- remote_write
- rule_files
- The Prometheus receiver is Stateful, which means there are important details to consider when using it:
- The collector cannot auto-scale the scraping process when multiple replicas of the collector are run.
- When running multiple replicas of the collector with the same config, it will scrape the targets multiple times.
- Users need to configure each replica with a different scraping configuration if they want to manually shard the scraping process.
- To make configuring the Prometheus receiver easier, the OpenTelemetry Operator includes an optional component called the Target Allocator.
- This component can be used to tell a collector which Prometheus endpoints it should scrape.
Host Metrics Receiver
| Deployment Pattern | Usable |
|---|---|
| DaemonSet (agent) | Preferred |
| Deployment (gateway) | Yes, but only collects metrics from the node it is deployed on |
| Sidecar | No |
- The Host Metrics Receiver collects metrics from a host using a variety of scrapers.
- There is some overlap with the Kubeletstats Receiver so if you decide to use both, it may be worth it to disable these duplicate metrics.
- In Kubernetes, the receiver needs access to the hostfs volume to work properly.
- If you’re using the OpenTelemetry Collector Helm chart you can use the hostMetrics preset to get started.
The available scrapers are:
Not supported on macOS when compiled without cgo, which is the default for the images released by the Collector SIG.
| Scraper | Supported OSs | Description |
|---|---|---|
| cpu | All except macOS | CPU utilization metrics |
| disk | All except macOS | Disk I/O metrics |
| load | All | CPU load metrics |
| filesystem | All | File System utilization metrics |
| memory | All | Memory utilization metrics |
| network | All | Network interface I/O metrics & TCP connection metrics |
| paging | All | Paging/Swap space utilization and I/O metrics |
| processes | Linux, macOS | Process count metrics |
| process | Linux, macOS, Windows | Per process CPU, Memory, and Disk I/O metrics |
make sure to mount the hostfs volume if you want to collect the node’s metrics and not the container’s.
1 |
|
and then configure the Host Metrics Receiver to use the volumeMount:
1 | receivers: |
Helm Charts
- You can use OpenTelemetry Helm Charts to manage installs of the OpenTelemetry Collector, OpenTelemetry Operator, and OpenTelemetry Demo.
- Add the OpenTelemetry Helm repository with:
1 | helm repo add open-telemetry https://open-telemetry.github.io/opentelemetry-helm-charts |
Collector Chart
- The OpenTelemetry Collector is an important tool for monitoring a Kubernetes cluster and all the services that in within.
- To facilitate installation and management of a collector deployment in a Kubernetes
- the OpenTelemetry community created the OpenTelemetry Collector Helm Chart.
- This helm chart can be used to install a collector as a Deployment, Daemonset, or Statefulset.
To install the chart with the release name my-opentelemetry-collector, run the following commands:
1 | helm repo add open-telemetry https://open-telemetry.github.io/opentelemetry-helm-charts |
- The OpenTelemetry Collector Chart requires that mode is set.
- mode can be either daemonset, deployment, or statefulset depending on which kind of Kubernetes deployment your use case requires.
- When installed, the chart provides a few default collector components to get you started. By default, the collector’s config will look like:
1 | exporters: |
- The chart will also enable ports based on the default receivers.
- Default configuration can be removed by setting the value to null in your values.yaml.
- Ports can be disabled in the values.yaml as well.
- You can add/modify any part of the configuration using the config section in your values.yaml.
- When changing a pipeline, you must explicitly list all the components that are in the pipeline, including any default components.
- For example, to disable metrics and logging pipelines and non-otlp receivers:
1 | config: |
- Many of the important components the OpenTelemetry Collector uses
- to monitor Kubernetes require special setup in the Collector’s own Kubernetes deployment.
- In order to make using these components easier, the OpenTelemetry Collector Chart comes with some presets that
- when enabled, handle the complex setup for these important components.
- Presets should be used as a starting point.
- They configure basic, but rich, functionality for their related components.
- If your use case requires extra configuration of these components
- it is recommend to NOT use the preset and instead manually configure the component and anything it requires (volumes, RBAC, etc.).
Logs Collection Preset
logs
- The OpenTelemetry Collector can be used to collect logs sent to standard output by Kubernetes containers.
- This feature is disabled by default. It has the following requirements in order to be safely enabled:
- It requires the Filelog receiver be included in the Collector image, such as the Contrib distribution of the Collector
- Although not a strict requirement, it is recommended this preset be used with mode=daemonset.
- The filelogreceiver will only be able to collect logs on the node the Collector is running
- and multiple configured Collectors on the same node will produce duplicate data.
- To enable this feature, set the presets.logsCollection.enabled property to true.
- When enabled, the chart will add a filelogreceiver to the logs pipeline.
- This receiver is configured to read the files where Kubernetes container runtime writes all containers’ console output.
/var/log/pods/*/*/*.log
1 | mode: daemonset |
- The chart’s default logs pipeline uses the debugexporter.
- Paired with the logsCollection preset’s filelogreceiver
- it is easy to accidentally feed the exported logs back into the collector, which can cause a “log explosion”.
- To prevent the looping, the default configuration of the receiver excludes the collector’s own logs.
- If you want to include the collector’s logs
- make sure to replace the debug exporter with an exporter that does not send logs to collector’s standard output.
- Here’s an example values.yaml that replaces the default debug exporter on the logs pipeline with an otlphttp exporter
- that sends the container logs to https://example.com:55681 endpoint.
- It also uses presets.logsCollection.includeCollectorLogs to tell the preset to enable collection of the collector’s logs.
1 | mode: daemonset |
Kubernetes Attributes Preset
all
- The OpenTelemetry Collector can be configured to add Kubernetes metadata
- such as k8s.pod.name, k8s.namespace.name, and k8s.node.name, to logs, metrics and traces.
- It is highly recommended to use the preset, or enable the k8sattributesprocessor manually.
- Due to RBAC considerations, this feature is disabled by default. It has the following requirements:
- It requires the Kubernetes Attributes processor be included in the Collector image, such as the Contrib distribution of the Collector.
- To enable this feature, set the presets.kubernetesAttributes.enabled property to true.
- When enabled, the chart will add the necessary RBAC roles to the ClusterRole and will add a k8sattributesprocessor to each enabled pipeline.
1 | mode: daemonset |
Kubelet Metrics Preset
metrics
- The OpenTelemetry Collector can be configured to collect node, pod, and container metrics from the API server on a kubelet.
- This feature is disabled by default. It has the following requirements:
- It requires the Kubeletstats receiver be included in the Collector image, such as the Contrib distribution of the Collector.
- Although not a strict requirement, it is recommended this preset be used with mode=daemonset.
- The kubeletstatsreceiver will only be able to collect metrics on the node the Collector is running
- and multiple configured Collectors on the same node will produce duplicate data.
- To enable this feature, set the presets.kubeletMetrics.enabled property to true.
- When enabled, the chart will add the necessary RBAC roles to the ClusterRole and will add a kubeletstatsreceiver to the metrics pipeline.
1 | mode: daemonset |
Cluster Metrics Preset
metrics
- The OpenTelemetry Collector can be configured to collect cluster-level metrics from the Kubernetes API server.
- These metrics include many of the metrics collected by Kube State Metrics.
- This feature is disabled by default. It has the following requirements:
- It requires the Kubernetes Cluster receiver be included in the Collector image, such as the Contrib distribution of the Collector.
- Although not a strict requirement, it is recommended this preset be used with mode=deployment or mode=statefulset with a single replica.
- Running k8sclusterreceiver on multiple Collectors will produce duplicate data.
- To enable this feature, set the presets.clusterMetrics.enabled property to true.
- When enabled, the chart will add the necessary RBAC roles to the ClusterRole and will add a k8sclusterreceiver to the metrics pipeline.
1 | mode: deployment |
Kubernetes Events Preset
logs
- The OpenTelemetry Collector can be configured to collect Kubernetes events.
- This feature is disabled by default. It has the following requirements:
- It requires the Kubernetes Objects receiver be included in the Collector image, such as the Contrib distribution of the Collector.
- Although not a strict requirement, it is recommended this preset be used with mode=deployment or mode=statefulset with a single replica.
- Running k8sclusterreceiver on multiple Collectors will produce duplicate data.
- To enable this feature, set the presets.kubernetesEvents.enabled property to true.
- When enabled, the chart will add the necessary RBAC roles to the ClusterRole
- and will add a k8sobjectsreceiver to the logs pipeline configure to only collector events.
1 | mode: deployment |
Host Metrics Preset
metrics
- The OpenTelemetry Collector can be configured to collect host metrics from Kubernetes nodes.
- This feature is disabled by default. It has the following requirements:
- It requires the Host Metrics receiver be included in the Collector image, such as the Contrib distribution of the Collector.
- Although not a strict requirement, it is recommended this preset be used with mode=daemonset.
- The hostmetricsreceiver will only be able to collect metrics on the node the Collector is running
- and multiple configured Collectors on the same node will produce duplicate data.
- To enable this feature, set the presets.hostMetrics.enabled property to true.
- When enabled, the chart will add the necessary volumes and volumeMounts and will add a hostmetricsreceiver to the metrics pipeline.
- By default metrics will be scrapped every 10 seconds and the following scrappers are enabled:
- cpu + load + memory + disk +
filesystem[^1]+ network [^1]due to some overlap with the kubeletMetrics preset some filesystem types and mount points are excluded by default.
1 | mode: daemonset |
Demo Chart
TBD
Operator Chart
- The OpenTelemetry Operator is a Kubernetes operator that manages OpenTelemetry Collectors and auto-instrumentation of workloads.
- One of the ways to install the OpenTelemetry Operator is via the OpenTelemetry Operator Helm Chart.
Installing the Chart
This will install an OpenTelemetry Operator with a self-signed certificate and secret.
1 | helm repo add open-telemetry https://open-telemetry.github.io/opentelemetry-helm-charts |
Configuration
- The Operator helm chart’s default values.yaml is ready to be installed, but it expects that Cert Manager is already present on the Cluster.
- In Kubernetes, in order for the API server to communicate with the webhook component
- the webhook requires a TLS certificate that the API server is configured to trust.
- The easiest and default method is to install the cert-manager and set admissionWebhooks.certManager.enabled to true.
- In this way, cert-manager will generate a self-signed certificate.
- You can provide your own Issuer by configuring the admissionWebhooks.certManager.issuerRef value.
- You will need to specify the kind (Issuer or ClusterIssuer) and the name.
- Note that this method also requires the installation of cert-manager.
- You can use an automatically generated self-signed certificate
- by setting admissionWebhooks.certManager.enabled to false and admissionWebhooks.autoGenerateCert.enabled to true.
- Helm will create a self-signed cert and a secret for you.
- You can use your own generated self-signed certificate
- by setting both admissionWebhooks.certManager.enabled and admissionWebhooks.autoGenerateCert.enabled to false.
- You should provide the necessary values to admissionWebhooks.cert_file, admissionWebhooks.key_file, and admissionWebhooks.ca_file.
- You can side-load custom webhooks and certificate
- by disabling .Values.admissionWebhooks.create and admissionWebhooks.certManager.enabled
- while setting your custom cert secret name in admissionWebhooks.secretName
- You can disable webhooks all together
- by disabling .Values.admissionWebhooks.create and setting env var .Values.manager.env.ENABLE_WEBHOOKS to false
Kubernetes Operator
that manages collectors and auto-instrumentation of the workload using OpenTelemetry instrumentation libraries.
- The OpenTelemetry Operator is an implementation of a Kubernetes Operator.
- The operator manages:
- OpenTelemetry Collector
- auto-instrumentation of the workloads using OpenTelemetry instrumentation libraries
To install the operator in an existing cluster, make sure you have cert-manager installed and run:
1 | kubectl apply -f https://github.com/open-telemetry/opentelemetry-operator/releases/latest/download/opentelemetry-operator.yaml |
Once the opentelemetry-operator deployment is ready, create an OpenTelemetry Collector (otelcol) instance, like:
1 | $ kubectl apply -f - <<EOF |
Injecting Auto-instrumentation
TBD
Target Allocator
TBD
Troubleshooting
TBD