Python - Debug + Profile
pdb
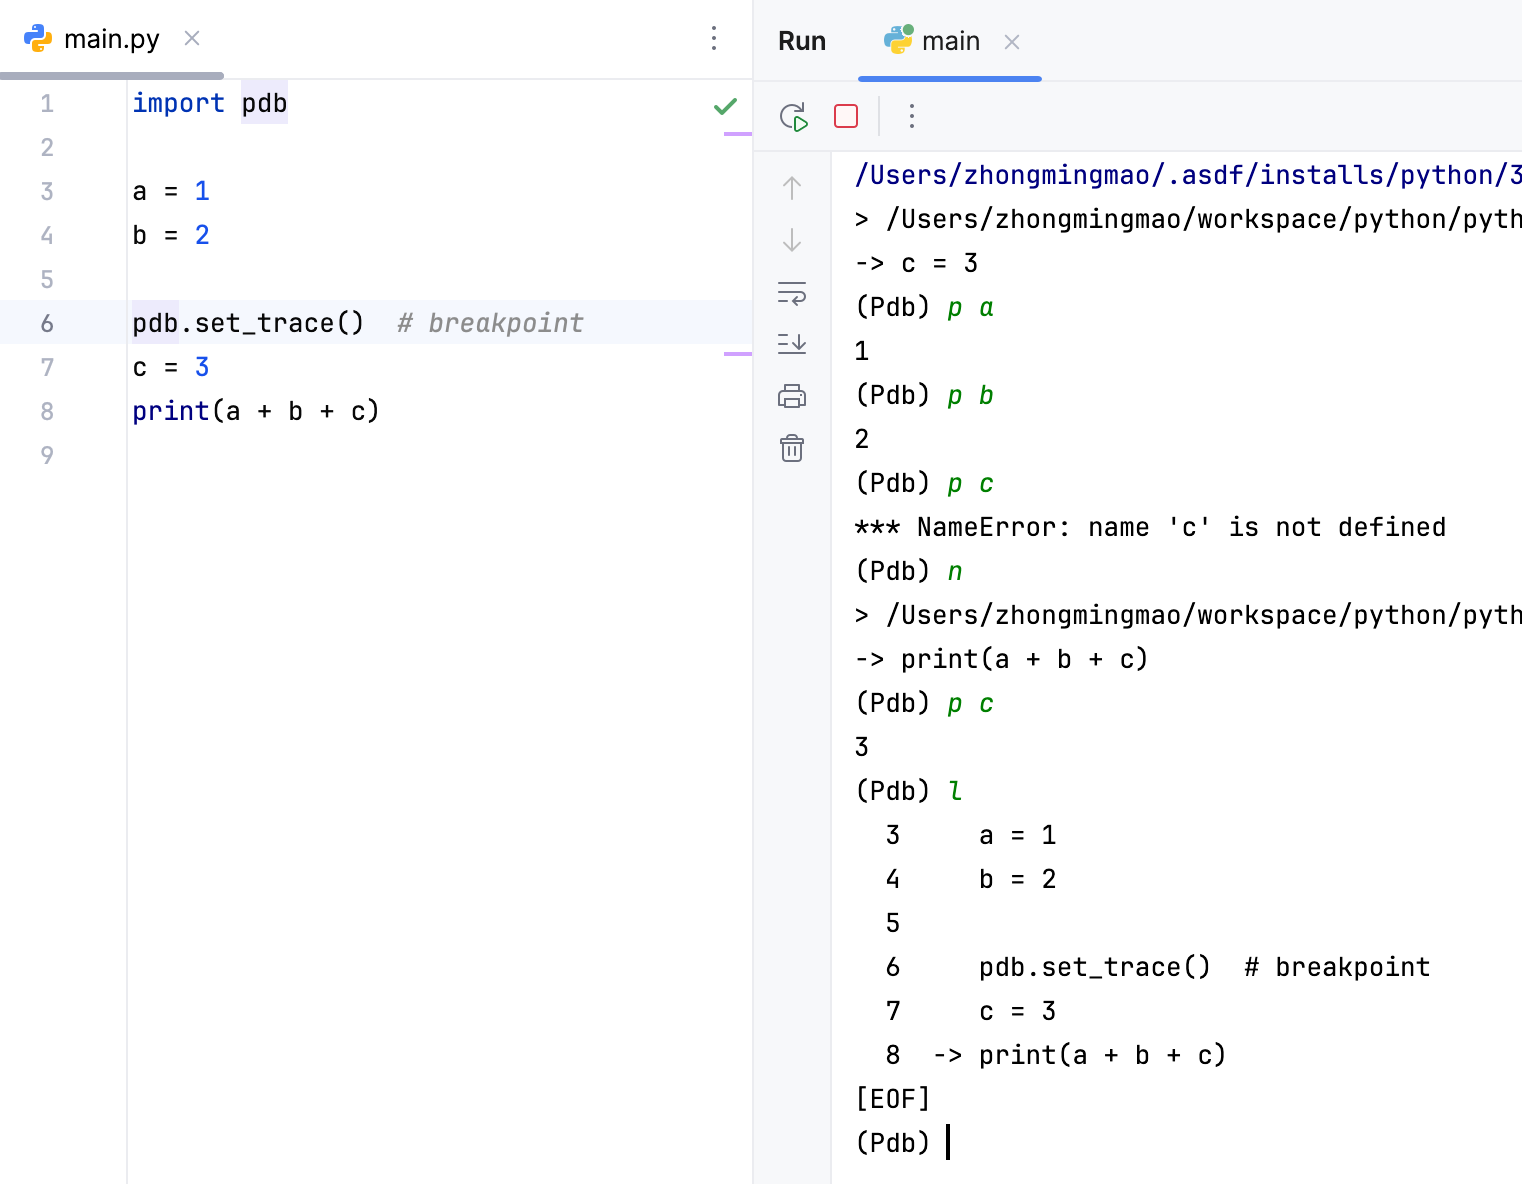
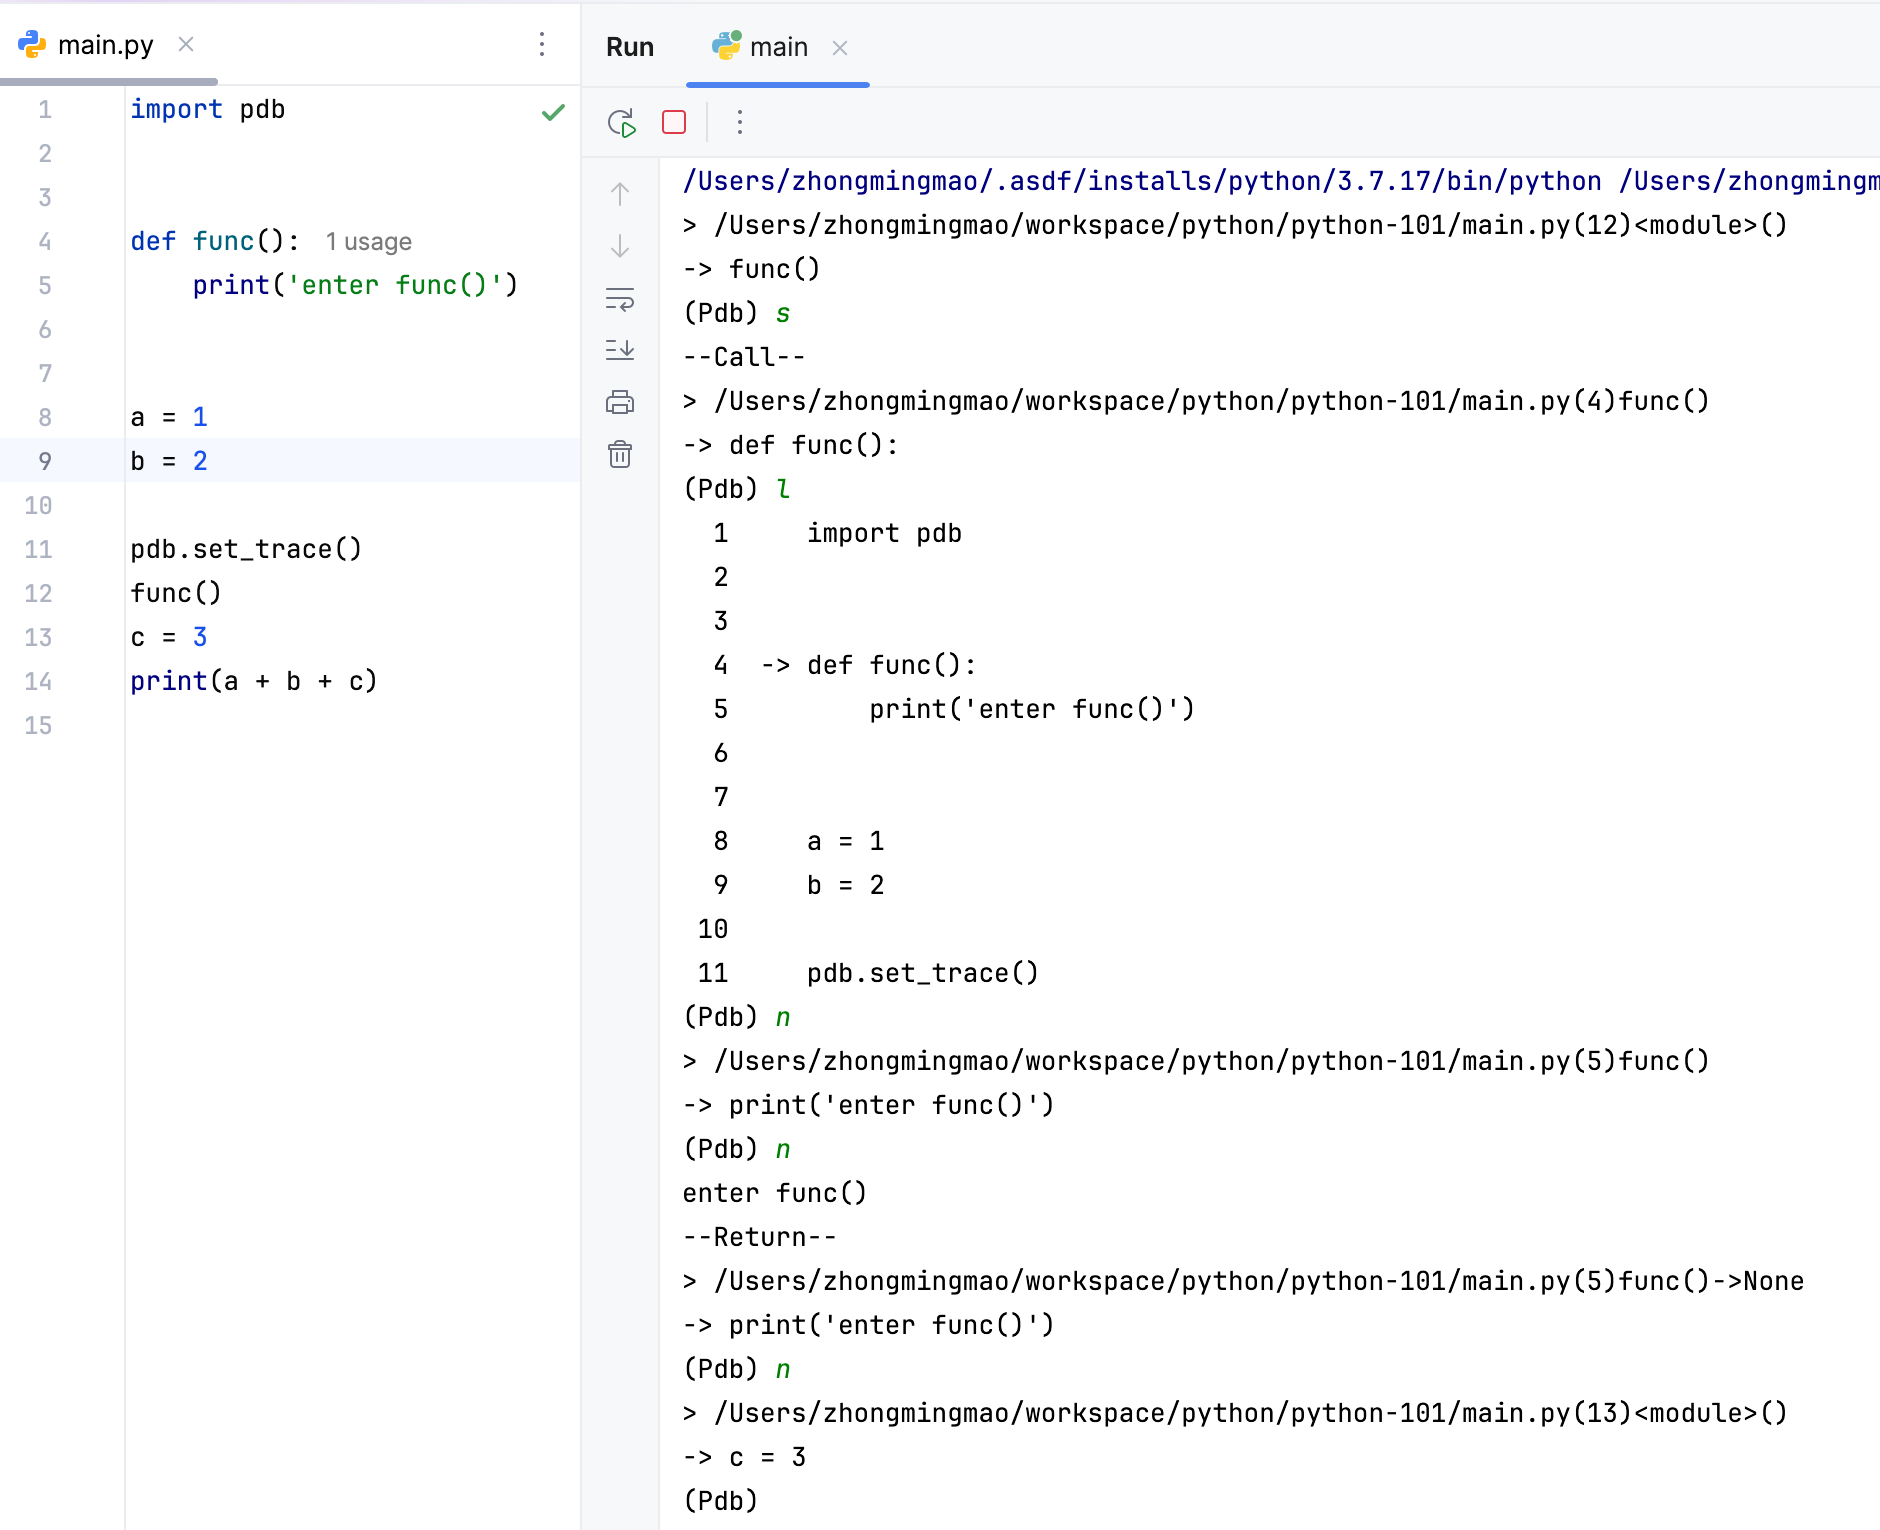
pdb 是 Python 自带的调试库,为 Python 程序提供交互式的源代码调试功能,是命令行版本的 IDE 断点调试器
| Instruction | Desc |
|---|---|
| p | |
| n | next - step over |
| l | list - show source code context |
| s | step into |
| r | stop out - 继续执行,直到当前函数完成后返回 |
| `b [ ([filename:]lineno | function) [, condition] ]` |
| c | continue - 一直执行程序,直到遇到下一个断点 |
step into -
--Call--+--Return--
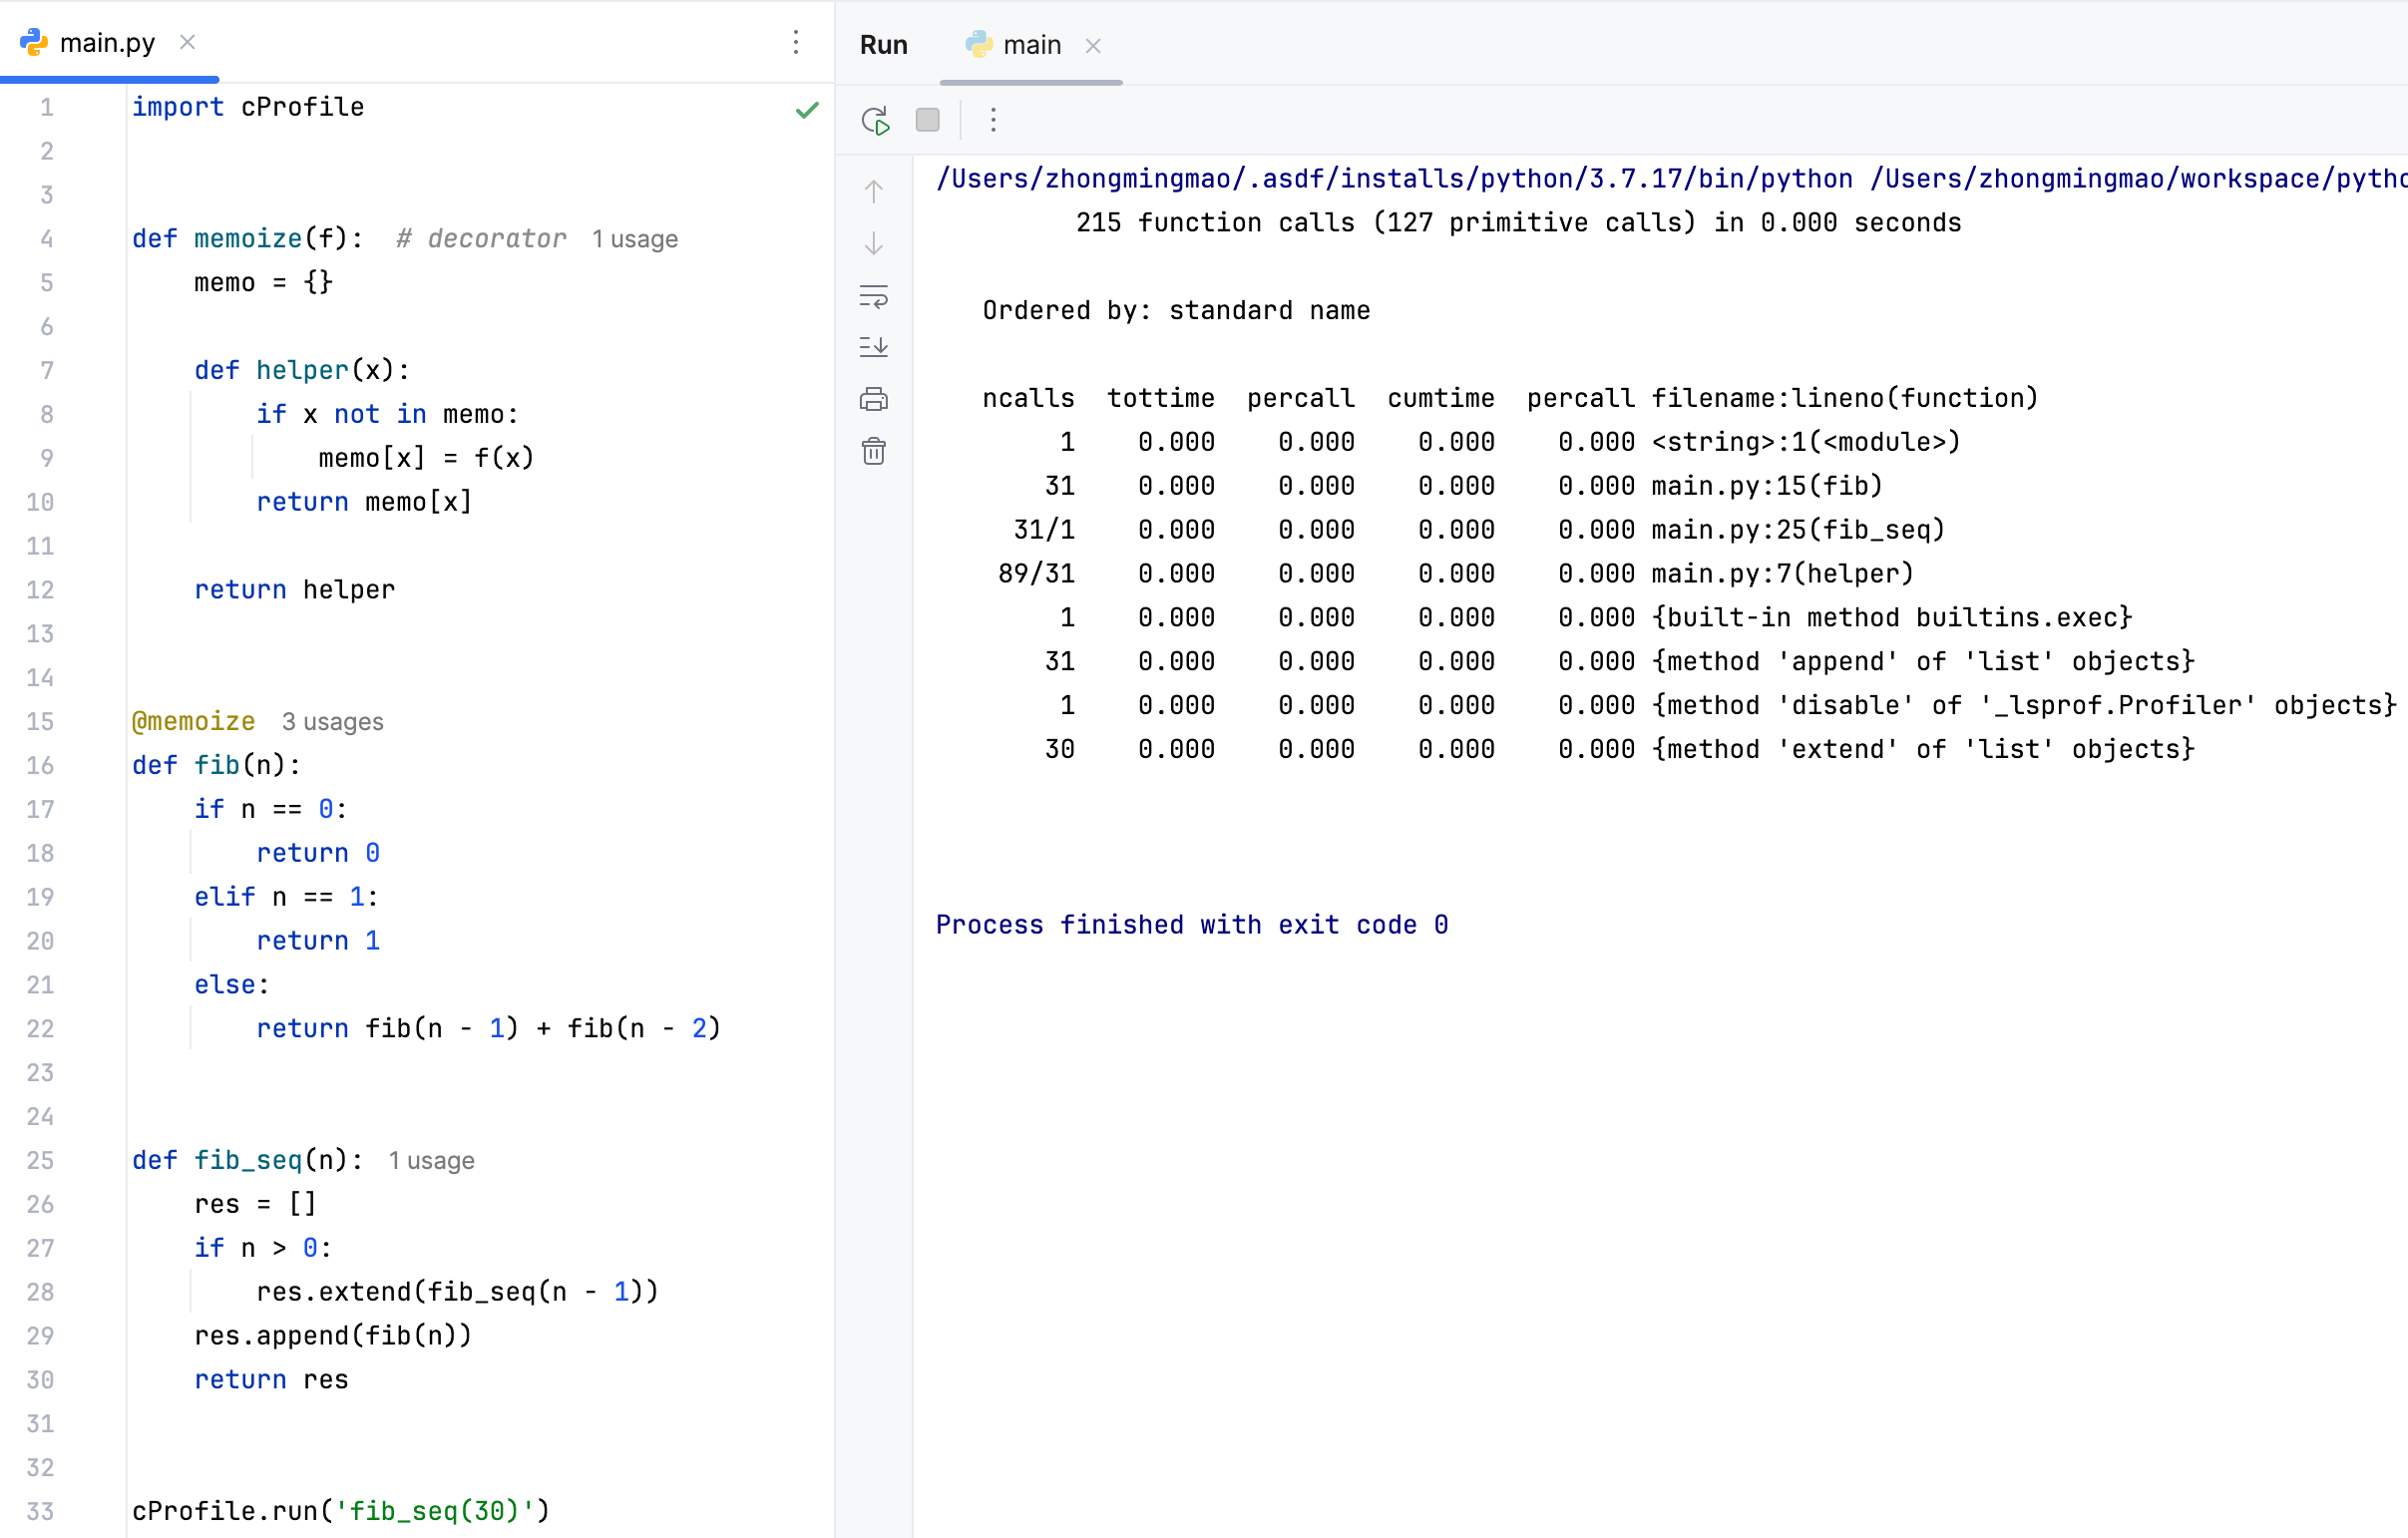
cProfile
瓶颈在于 fib 函数

| Item | Desc |
|---|---|
| ncalls | 相应代码/函数被调用的次数 |
| tottime | 相应代码/函数总共执行所需的时间(不包括它调用其它代码/函数的执行时间) |
| tottime percall | tottime / ncalls |
| cumtime | 相应代码/函数总共执行所需的时间(包括它调用其它代码/函数的执行时间) |
| cumtime percall | cumtime / ncalls |
| filename:lineno(function) | 相应代码/函数位置 |
通过字典保存计算过的 fib 结果
All articles on this blog are licensed under CC BY-NC-SA 4.0 unless otherwise stated.
Related Articles
2024-09-02
Python - Coroutine
基础 协程是实现并发编程的一种方式 多线程/多进程模型,是解决并发问题的经典模式 C10K - 线程/进程上下文切换占用大量资源 Nginx Event loop 启动一个统一的调度器,让调度器来决定一个时刻去运行哪个任务 节省了多线程中启动线程、管理线程、同步锁等各种开销 相比于 Apache,用更低的资源支持更多的并发连接 Callback hell - JavaScript 继承了 Event loop 的优越性,同时还提供 async / await 语法糖,解决了执行性和可读性共存的难题 协程开始崭露头角,尝试使用 Node.js 实现后端 Python 3.7 提供基于 asyncio 的 async / await 方法 同步 简单实现 12345678910111213141516import timedef crawl_page(url): print('crawling {}'.format(url)) sleep_time = int(url.split('_&...
2024-08-28
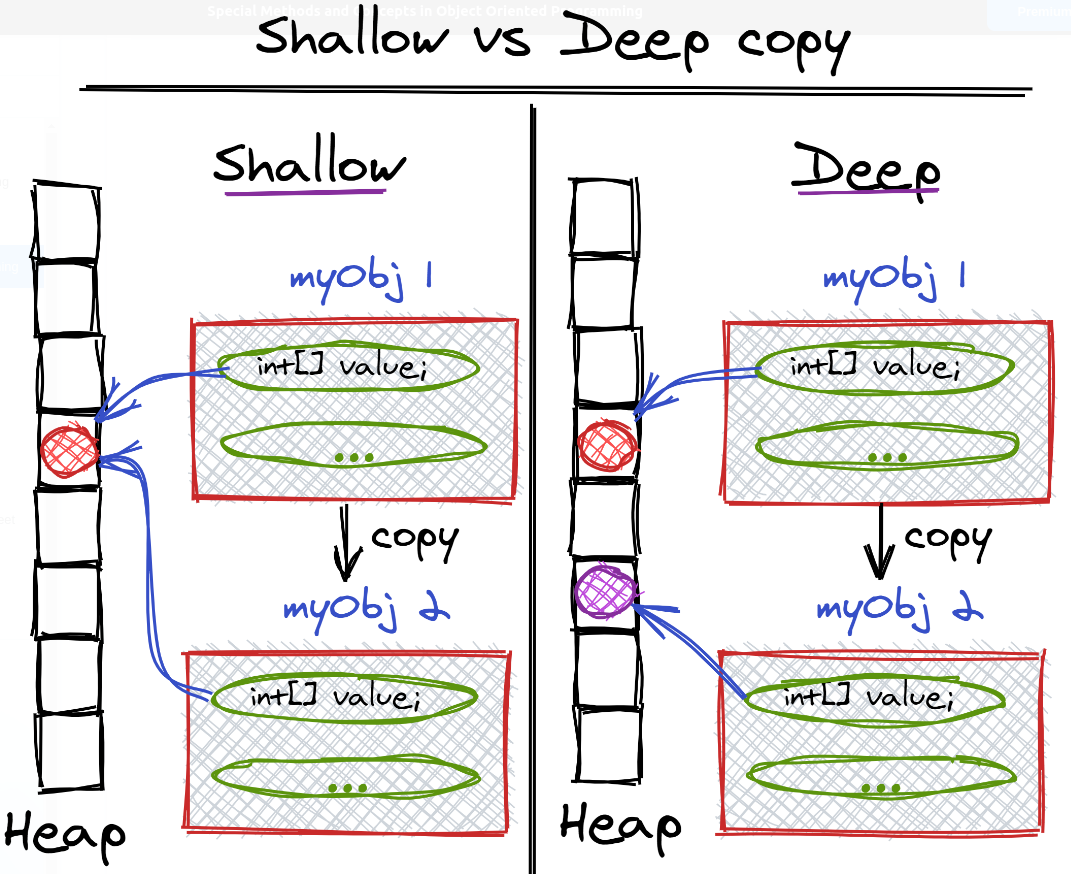
Python - Compare + Copy
== vs is == 比较对象之间的值是否相等,类似于 Java 中的 equals is 比较的是对象的身份标识是否相等,即是否为同一个对象,是否指向同一个内存地址,类似于 Java 中的 == is None or is not None 在 Python 中,每个对象的身份标识,都能通过 id(object) 函数获得,is 比较的是对象之间的 ID 是否相等 类似于 Java 对象的 HashCode 在实际工作中,**== 更常用,一般关心的是两个变量的值,而非内部存储地址** 12345678a = 10 # allocate memory for 10b = 10 # point to the same memory location as aprint(a == b) # Trueprint(id(a)) # 4376158344print(id(b)) # 4376158344print(a is b) # True a is b 为 True,仅适用于 -5 ~ 256 范...
2024-08-22
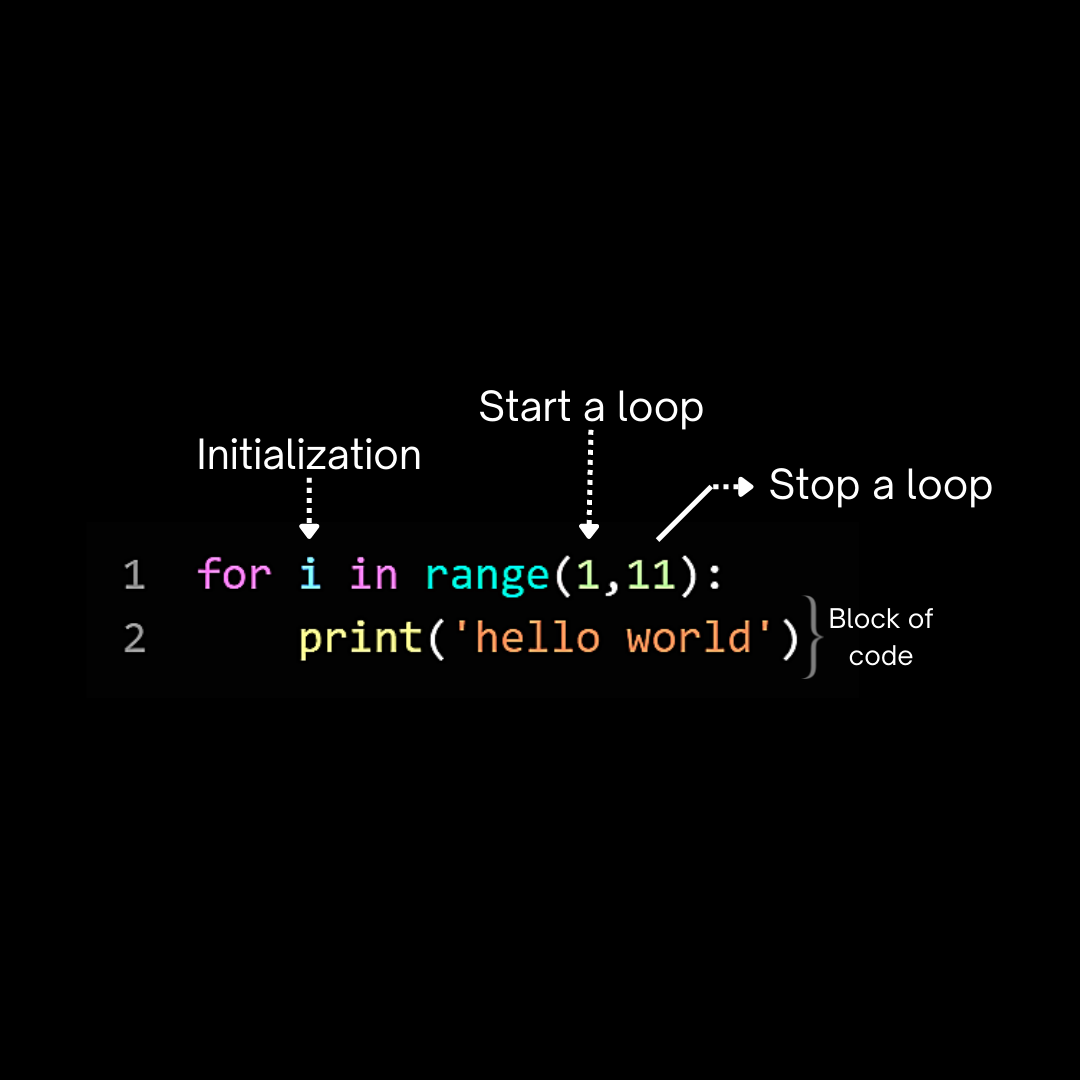
Python - Condition + Loop
条件 不能在条件语句中加括号,必须在条件末尾加上 : 12345678x = int(input("Enter a number: "))if x < 0: y = -xelse: y = xprint(f"The absolute value of {x} is {y}.") Python 不支持 switch 语句 - elif - 顺序执行 12345678x = int(input("Enter a number: "))if x == 0: print('red')elif x == 1: print('yellow')else: print('green') 省略用法 - 除了 Boolean 类型的数据,判断条件最好是显性的 循环 for + while 123l = [1, 2, 3, 4]for e in l: print(e) 只要数据结构是 Iterable...
2024-08-18
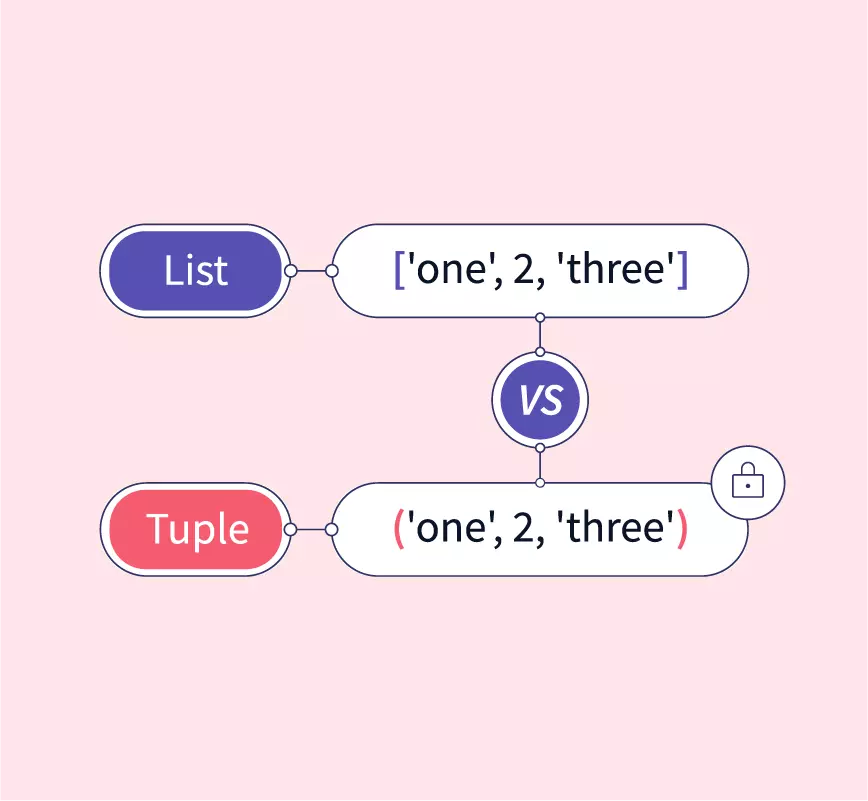
Python - List + Tuple
基础 列表和元组都是可以放置任意数据类型的有序集合 - 绝大多数编程语言,集合的数据类型必须一致 12l = [1, 2, 'hello', 'world']t = ('json', 22) 列表是动态的(mutable),而元组是静态的(immutable) 123456l = [1, 2, 3, 4] # mutablel[3] = 40print(l) # [1, 2, 3, 40]t = (1, 2, 3, 4) # immutable# t[3] = 40 # TypeError: 'tuple' object does not support item assignment 为元组追加新元素,只能新建元组 123t1 = (1, 2, 3, 4)t2 = t1 + (5,)print(t2) # (1, 2, 3, 4, 5) 为列表追加新元素,可以直接追加到列表末尾 123l = [1, 2, 3, 4]l.append(5)print(l) # [1, 2, 3, 4, 5...
2024-08-21
Python - IO
基础1234567891011name = input('your name:')gender = input('you are a boy? (y/n)')welcome_str = 'Welcome to the matrix {prefix} {name}.'welcome_dic = { 'prefix': 'Mr.' if gender == 'y' else 'Mrs.', 'name': name}print('authorizing...')print(welcome_str.format(**welcome_dic)) input() 函数暂停程序运行,等待键盘输入,直到回车被按下 函数的参数为提示语,输入的类型永远都是字符串(string) print() 函数则接受字符串、数字、字典、列表和自定义类 input() 的...
2024-08-19
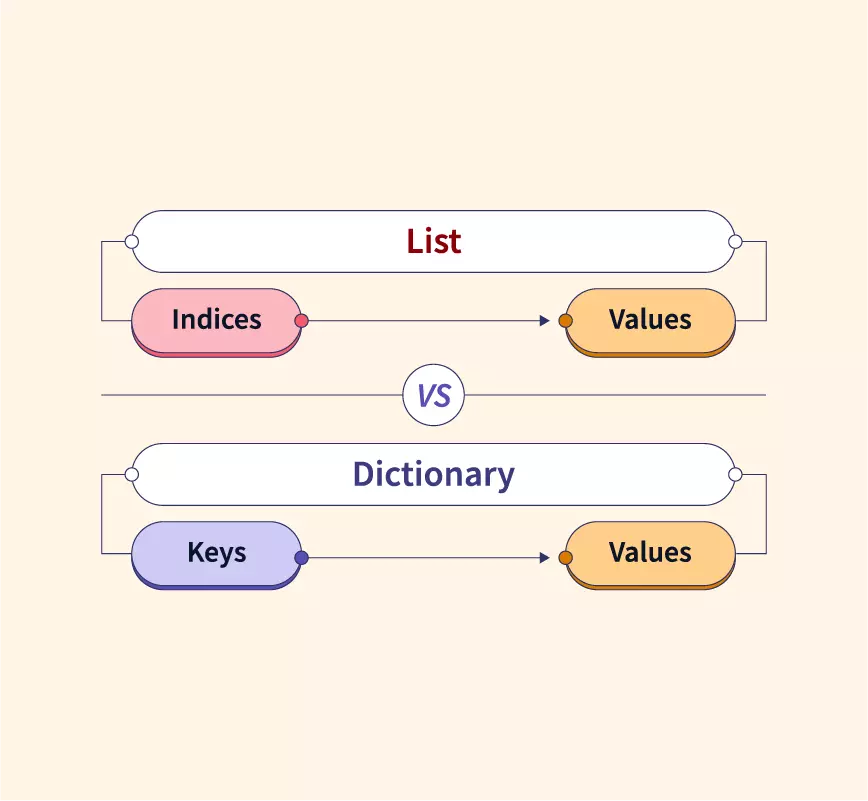
Python - Dict + Set
基础 字典是由 kv 对组成的元素的集合,在 Python 3.7+,字典被确定为有序 相比于列表和元组,字典的性能更优,对于查找、添加和删除操作,时间复杂度为 O(1) 集合是一系列唯一无序的元素组合 字典和集合,无论是 Key 还是 Value,都可以是混合类型 字典初始化 123456789d1 = {'name': 'jason', 'age': 20, 'gender': 'male'}d2 = dict({'name': 'jason', 'age': 20, 'gender': 'male'})d3 = dict([('name', 'jason'), ('age', 20), ('gender', 'male')])d4 = dict(name...