Overview Status and Releases
Traces
Metrics
Logs
Stable
Stable
Development
Client instrumentation for the browser is experimental and mostly unspecified .
Version Support
OpenTelemetry JavaScript supports all active or maintenance LTS versions of Node.js .
Previous versions of Node.js may work, but are not tested by OpenTelemetry.
OpenTelemetry JavaScript has no official supported list of browsers. It is aimed to work on currently supported versions of major browsers .
OpenTelemetry JavaScript follows DefinitelyType’s support policy for TypeScript which sets a support window of 2 years .
Support for TypeScript versions older than 2 years will be dropped in minor releases of OpenTelemetry JavaScript.
Repositories
OpenTelemetry JavaScript consists of the following repositories
Repositories
Desc
opentelemetry-js
core repository containing the core distribution API and SDK.
opentelemetry-js-contrib
contributions that are not part of the core distribution of the API and SDK.
Getting Started Node.js Example Application Dependencies
To begin, set up an empty package.json in a new directory:
Next, install Express dependencies.
Create and launch an HTTP Server
Create a file named app.ts (or app.js if not using TypeScript) and add the following code to it:
1 2 3 4 5 6 7 8 9 10 11 12 13 14 15 16 17 18 const express = require ('express' );const PORT = parseInt (process.env .PORT || '8080' );const app = express ();function getRandomNumber (min, max ) { return Math .floor (Math .random () * (max - min + 1 ) + min); } app.get ('/rolldice' , (req, res ) => { res.send (getRandomNumber (1 , 6 ).toString ()); }); app.listen (PORT , () => { console .log (`Listening for requests on http://localhost:${PORT} ` ); });
Run the application with the following command and open http://localhost:8080/rolldice in your web browser to ensure it is working.
Instrumentation
The following shows how to install, initialize, and run an application instrumented with OpenTelemetry .
More Dependencies
First, install the Node SDK and autoinstrumentations package.
The Node SDK lets you initialize OpenTelemetry with several configuration defaults that are correct for the majority of use cases .
The auto-instrumentations-node package installs instrumentation libraries
that will automatically create spans corresponding to code called in libraries.
In this case, it provides instrumentation for Express, letting the example app automatically create spans for each incoming request .
1
2
3
4
5
$ npm install @opentelemetry/sdk-node \ @opentelemetry/api \ @opentelemetry/auto-instrumentations-node \ @opentelemetry/sdk-metrics \ @opentelemetry/sdk-trace-node
Setup
The instrumentation setup and configuration must be run before your application code .
One tool commonly used for this task is the –require flag
Create a file named instrumentation.ts (or instrumentation.js if not using TypeScript) , which will contain your instrumentation setup code .
1 2 3 4 5 6 7 8 9 10 11 12 13 14 15 16 17 18 19 20 21 const { NodeSDK } = require ('@opentelemetry/sdk-node' );const { ConsoleSpanExporter } = require ('@opentelemetry/sdk-trace-node' );const { getNodeAutoInstrumentations, } = require ('@opentelemetry/auto-instrumentations-node' ); const { PeriodicExportingMetricReader , ConsoleMetricExporter , } = require ('@opentelemetry/sdk-metrics' ); const sdk = new NodeSDK ({ traceExporter : new ConsoleSpanExporter (), metricReader : new PeriodicExportingMetricReader ({ exporter : new ConsoleMetricExporter (), }), instrumentations : [getNodeAutoInstrumentations ()], }); sdk.start ();
Run the instrumented app
Now you can run your application as you normally would, but you can use the –require flag to load the instrumentation before the application code.
Make sure you don’t have other conflicting –require flags
such as –require @opentelemetry/auto-instrumentations-node/register on your NODE_OPTIONS environment variable.
1 $ node --require ./instrumentation.js app.js
After a while you should see the spans printed in the console by the ConsoleSpanExporter.
1
2
3
4
5
6
7
8
9
10
11
12
13
14
15
16
17
18
19
20
21
22
23
24
25
26
27
28
29
30
31
32
33
34
35
36
37
38
39
40
41
42
43
44
45
46
47
48
49
50
51
52
53
{ resource: { attributes: { 'host.name': 'macos.local', 'host.arch': 'arm64', 'host.id': '359031 FF-956E-5 B48-89 FD-8 A78A79AE606', 'process.pid': 48319 , 'process.executable.name': '/Users/zhongmingmao/.asdf/installs/nodejs/22.17 .1 /bin/node', 'process.executable.path': '/Users/zhongmingmao/.asdf/installs/nodejs/22.17 .1 /bin/node', 'process.command_args': [ '/Users/zhongmingmao/.asdf/installs/nodejs/22.17 .1 /bin/node', '--require', './instrumentation.js', '/Users/zhongmingmao/workspace/o11y/demo/voyager-o11y-demo-nodejs/app.js' ] , 'process.runtime.version': '22.17 .1 ', 'process.runtime.name': 'nodejs', 'process.runtime.description': 'Node.js', 'process.command': '/Users/zhongmingmao/workspace/o11y/demo/voyager-o11y-demo-nodejs/app.js', 'process.owner': 'zhongmingmao', 'service.name': 'unknown_service: /Users/zhongmingmao/.asdf/installs/nodejs/22.17 .1 /bin/node', 'telemetry.sdk.language': 'nodejs', 'telemetry.sdk.name': 'opentelemetry', 'telemetry.sdk.version': '2.0 .1 ' } } , instrumentationScope: { name: '@opentelemetry/instrumentation-express', version: '0.52 .0 ', schemaUrl: undefined } , traceId: '1 c4d83abd23a4fa49ad4e6a955e5a03a', parentSpanContext: { traceId: '1 c4d83abd23a4fa49ad4e6a955e5a03a', spanId: 'd598ef141c576722', traceFlags: 1 , traceState: undefined } , traceState: undefined, name: 'request handler - /rolldice', id: 'f3353278dc575cf5', kind: 0 , timestamp: 1752998752442000 , duration: 5187 , attributes: { 'http.route': '/rolldice', 'express.name': '/rolldice', 'express.type': 'request_handler' } , status: { code: 0 } , events: [ ] , links: [ ] }
1
2
3
4
5
6
7
8
9
10
11
12
13
14
15
16
17
18
19
20
21
22
23
24
25
{ descriptor: { name: 'v8js.memory.heap.space.physical_size', type: 'OBSERVABLE_GAUGE', description: 'Committed size of a heap space.', unit: 'By', valueType: 1 , advice: { } } , dataPointType: 2 , dataPoints: [ { attributes: { 'v8js.heap.space.name': 'read_only_space' } , startTime: [ 1752998810 , 399000000 ] , endTime: [ 1752999110 , 405000000 ] , value: 0 } , { attributes: { 'v8js.heap.space.name': 'new_space' } , startTime: [ 1752998810 , 399000000 ] , endTime: [ 1752999110 , 405000000 ] , value: 557056 } ] }
Browser Example Application
Copy the following file into an empty directory and call it index.html.
1
2
3
4
5
6
7
8
9
10
11
12
13
14
15
16
17
18
19
20
21
22
23
24
25
26
<!doctype html > <html lang ="en" > <head > <meta charset ="utf-8" /> <title > Document Load Instrumentation Example</title > <base href ="/" /> <meta name ="traceparent" content ="00-ab42124a3c573678d4d8b21ba52df3bf-d21f7bc17caa5aba-01" /> <meta name ="viewport" content ="width=device-width, initial-scale=1" /> </head > <body > Example of using Web Tracer with document load instrumentation with console exporter and collector exporter </body > </html >
Installation To create traces in the browser, you will need @opentelemetry/sdk-trace-web , and the instrumentation @opentelemetry/instrumentation-document-load
1
2
3
4
5
$ npm init -y npm install @opentelemetry/api \ @opentelemetry/sdk-trace-web \ @opentelemetry/instrumentation-document-load \ @opentelemetry/context-zone
Initialization and Configuration
Then acquire parcel , which will (among other things) let you work in TypeScript.
1 $ npm install --save-dev parcel
Create an empty code file named document-load with a .ts or .js extension, as appropriate, based on the language you’ve chosen to write your app in.
Add the following code to your HTML right before the </body> closing tag:
1 <script type="module" src="document-load.js" ></script>
We will add some code that will trace the document load timings and output those as OpenTelemetry Spans .
Creating a Tracer Provider Add the following code to the document-load.ts|js to create a tracer provider, which brings the instrumentation to trace document load :
1 2 3 4 5 6 7 8 9 10 11 12 13 14 15 16 17 import { WebTracerProvider } from '@opentelemetry/sdk-trace-web' ;import { DocumentLoadInstrumentation } from '@opentelemetry/instrumentation-document-load' ;import { ZoneContextManager } from '@opentelemetry/context-zone' ;import { registerInstrumentations } from '@opentelemetry/instrumentation' ;const provider = new WebTracerProvider ();provider.register ({ contextManager : new ZoneContextManager (), }); registerInstrumentations ({ instrumentations : [new DocumentLoadInstrumentation ()], });
Now build the app with parcel :
1
2
3
$ npx parcel index.html Server running at http://localhost:1234 ✨ Built in 7ms
and open the development web server (e.g. at http://localhost:1234) to see if your code works.exporter .
Creating an Exporter
In the following example, we will use the ConsoleSpanExporter which prints all spans to the console.
In order to visualize and analyze your traces , you will need to export them to a tracing backend .
You may also want to use the BatchSpanProcessor to export spans in batches in order to more efficiently use resources.
1 2 3 4 5 6 7 8 9 10 11 12 13 14 15 16 17 18 19 20 21 22 23 import { ConsoleSpanExporter , SimpleSpanProcessor , } from '@opentelemetry/sdk-trace-base' ; import { WebTracerProvider } from '@opentelemetry/sdk-trace-web' ;import { DocumentLoadInstrumentation } from '@opentelemetry/instrumentation-document-load' ;import { ZoneContextManager } from '@opentelemetry/context-zone' ;import { registerInstrumentations } from '@opentelemetry/instrumentation' ;const provider = new WebTracerProvider ({ spanProcessors : [new SimpleSpanProcessor (new ConsoleSpanExporter ())], }); provider.register ({ contextManager : new ZoneContextManager (), }); registerInstrumentations ({ instrumentations : [new DocumentLoadInstrumentation ()], });
Now, rebuild your application and open the browser again. In the console of the developer toolbar you should see some traces being exported:
1
2
3
4
5
6
7
8
9
10
11
12
13
14
15
16
17
18
19
20
21
22
23
24
25
26
27
28
29
30
31
32
33
34
35
36
37
38
39
40
41
42
43
44
45
46
47
48
49
50
51
52
53
54
55
56
57
58
59
60
61
62
63
64
65
66
67
68
69
70
71
72
73
74
75
76
77
78
79
80
81
82
83
84
85
86
87
88
89
90
91
92
93
94
95
96
97
98
99
100
101
102
103
104
105
106
107
108
109
110
111
112
113
114
115
116
117
118
119
120
121
122
123
124
125
126
127
128
129
130
131
132
133
134
135
{ "resource" : { "attributes" : { "service.name" : "unknown_service" , "telemetry.sdk.language" : "webjs" , "telemetry.sdk.name" : "opentelemetry" , "telemetry.sdk.version" : "2.0.1" } } , "instrumentationScope" : { "name" : "@opentelemetry/instrumentation-document-load" , "version" : "0.48.0" } , "traceId" : "ab42124a3c573678d4d8b21ba52df3bf" , "parentSpanContext" : { "traceId" : "ab42124a3c573678d4d8b21ba52df3bf" , "spanId" : "d21f7bc17caa5aba" , "traceFlags" : 1 , "isRemote" : true } , "name" : "documentLoad" , "id" : "2a0091fcc2ed3065" , "kind" : 0 , "timestamp" : 1753001481973300 , "duration" : 133000 , "attributes" : { "http.url" : "http://localhost:1234/" , "http.user_agent" : "Mozilla/5.0 (Macintosh; Intel Mac OS X 10_15_7) AppleWebKit/537.36 (KHTML, like Gecko) Chrome/138.0.0.0 Safari/537.36" } , "status" : { "code" : 0 } , "events" : [ { "name" : "fetchStart" , "attributes" : { } , "time" : [ 1753001481 , 973300000 ] , "droppedAttributesCount" : 0 } , { "name" : "unloadEventStart" , "attributes" : { } , "time" : [ 1753001481 , 988000000 ] , "droppedAttributesCount" : 0 } , { "name" : "unloadEventEnd" , "attributes" : { } , "time" : [ 1753001481 , 988000000 ] , "droppedAttributesCount" : 0 } , { "name" : "domInteractive" , "attributes" : { } , "time" : [ 1753001482 , 53000000 ] , "droppedAttributesCount" : 0 } , { "name" : "domContentLoadedEventStart" , "attributes" : { } , "time" : [ 1753001482 , 79400000 ] , "droppedAttributesCount" : 0 } , { "name" : "domContentLoadedEventEnd" , "attributes" : { } , "time" : [ 1753001482 , 79700000 ] , "droppedAttributesCount" : 0 } , { "name" : "domComplete" , "attributes" : { } , "time" : [ 1753001482 , 106000000 ] , "droppedAttributesCount" : 0 } , { "name" : "loadEventStart" , "attributes" : { } , "time" : [ 1753001482 , 106100000 ] , "droppedAttributesCount" : 0 } , { "name" : "loadEventEnd" , "attributes" : { } , "time" : [ 1753001482 , 106300000 ] , "droppedAttributesCount" : 0 } , { "name" : "firstPaint" , "attributes" : { } , "time" : [ 1753001482 , 76000000 ] , "droppedAttributesCount" : 0 } , { "name" : "firstContentfulPaint" , "attributes" : { } , "time" : [ 1753001482 , 76000000 ] , "droppedAttributesCount" : 0 } ] , "links" : [ ] }
Add Instrumentations If you want to instrument Ajax requests, User Interactions and others, you can register additional instrumentations for those:
1
2
3
4
5
6
registerInstrumentations ({ instrumentations : [ new UserInteractionInstrumentation (), new XMLHttpRequestInstrumentation (), ], });
To leverage the most common instrumentations all in one you can simply use the OpenTelemetry Meta Packages for Web
https://www.npmjs.com/package/@opentelemetry/auto-instrumentations-web
Instrumentation
TBD
Libraries
How to instrument libraries an app depends on
When you develop an app, you might use third-party libraries and frameworks to accelerate your work.
If you then instrument your app using OpenTelemetry
you might want to avoid spending additional time to manually add traces, logs, and metrics to the third-party libraries and frameworks you use.
Many libraries and frameworks already support OpenTelemetry or are supported through OpenTelemetry instrumentation
so that they can generate telemetry you can export to an observability back end .
If you are instrumenting an app or service that use third-party libraries or frameworks
follow these instructions to learn how to use natively instrumented libraries and instrumentation libraries for your dependencies.
Use natively instrumented libraries
If a library comes with OpenTelemetry support by default
you can get traces, metrics, and logs emitted from that library by adding and setting up the OpenTelemetry SDK with your app.
The library might require some additional configuration for the instrumentation.
Instrumentation for Next.js
Use Instrumentation Libraries
If a library does not come with OpenTelemetry out of the box
For example, the instrumentation library for Express will automatically create spans based on the inbound HTTP requests .
Setup
Each instrumentation library is an NPM package .
For example, here’s how you can install the instrumentation-express and instrumentation-http instrumentation libraries to instrument inbound and outbound HTTP traffic
1 $ npm install --save @opentelemetry/instrumentation-http @opentelemetry/instrumentation-express
OpenTelemetry JavaScript also defines metapackages auto-instrumentation-node and auto-instrumentation-web
that bundle all Node.js- or **web-**based instrumentation libraries into a single package .
It’s a convenient way to add automatically-generated telemetry for all your libraries with minimal effort
Node.js
1 $ npm install --save @opentelemetry/auto-instrumentations-node
Browser
1 $ npm install --save @opentelemetry/auto-instrumentations-web
That using those metapackages increases your dependency graph size .
Use individual instrumentation libraries if you know exactly which ones you need.
Registration
After installing the instrumentation libraries you need, register them with the OpenTelemetry SDK for Node.js .
If you followed the Getting Started you already use the metapackages .
If you followed the instructions to initialize the SDK for manual instrumentation , update your instrumentation.ts (or instrumentation.js) as follows
1 2 3 4 5 6 7 8 const { getNodeAutoInstrumentations } = require ('@opentelemetry/auto-instrumentations-node' );const sdk = new NodeSDK ({ ... instrumentations : [getNodeAutoInstrumentations ()] });
To disable individual instrumentation libraries you can apply the following change:
1 2 3 4 5 6 7 8 9 10 11 12 13 14 const { getNodeAutoInstrumentations } = require ('@opentelemetry/auto-instrumentations-node' );const sdk = new NodeSDK ({ ... instrumentations : [ getNodeAutoInstrumentations ({ '@opentelemetry/instrumentation-fs' : { enabled : false , }, }), ], });
To only load individual instrumentation libraries , replace [getNodeAutoInstrumentations() ] with the list of those you need:
1 2 3 4 5 6 7 8 9 10 11 12 const { HttpInstrumentation } = require ("@opentelemetry/instrumentation-http" );const { ExpressInstrumentation } = require ("@opentelemetry/instrumentation-express" );const sdk = new NodeSDK ({ ... instrumentations : [ new HttpInstrumentation (), new ExpressInstrumentation (), ] });
Configuration
Some instrumentation libraries offer additional configuration options.
For example, Express instrumentation offers ways to ignore specified middleware or enrich spans created automatically with a request hook
1 2 3 4 5 6 7 8 9 10 11 12 13 14 15 16 17 18 const { SEMATTRS_HTTP_METHOD , SEMATTRS_HTTP_URL , } = require ('@opentelemetry/semantic-conventions' ); const { ExpressInstrumentation , ExpressLayerType , } = require ('@opentelemetry/instrumentation-express' ); const expressInstrumentation = new ExpressInstrumentation ({ requestHook : function (span, info ) { if (info.layerType === ExpressLayerType .REQUEST_HANDLER ) { span.setAttribute (SEMATTRS_HTTP_METHOD , info.request .method ); span.setAttribute (SEMATTRS_HTTP_URL , info.request .baseUrl ); } }, });
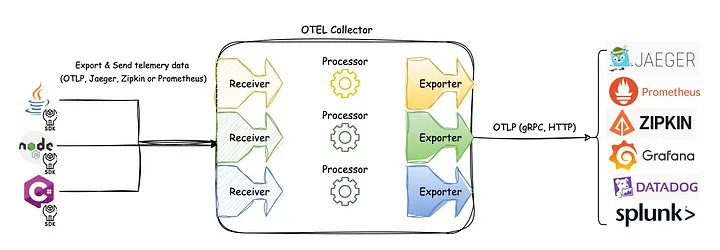
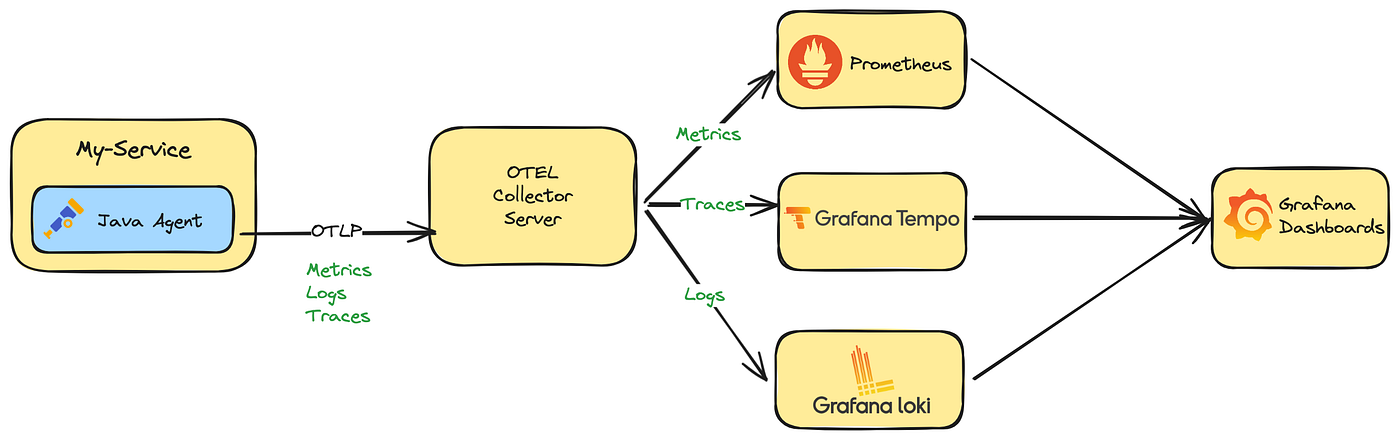
Exporters
Process and export your telemetry data
Send telemetry to the OpenTelemetry Collector to make sure it’s exported correctly.
Using the Collector in production environments is a best practice .
To visualize your telemetry, export it to a backend such as Jaeger , Zipkin , Prometheus , or a vendor-specific backend.
Available exporters
OpenTelemetry Protocol (OTLP) exporters are designed with the OpenTelemetry data model in mind, emitting OTel data without any loss of information.
Furthermore, many tools that operate on telemetry data support OTLP (such as Prometheus , Jaeger , and most vendors)
providing you with a high degree of flexibility when you need it.
OTLP Collector Setup
In an empty directory, create a file called collector-config.yaml with the following content:
1
2
3
4
5
6
7
8
9
10
11
12
13
14
15
16
17
18
19
20
21
receivers: otlp: protocols: grpc: endpoint: 0.0 .0 .0 :4317 http: endpoint: 0.0 .0 .0 :4318 exporters: debug: verbosity: detailed service: pipelines: traces: receivers: [otlp ] exporters: [debug ] metrics: receivers: [otlp ] exporters: [debug ] logs: receivers: [otlp ] exporters: [debug ]
Now run the collector in a docker container:
1 $ docker run -p 4317:4317 -p 4318:4318 --rm -v $(pwd)/collector-config.yaml:/etc/otelcol/config.yaml otel/opentelemetry-collector:0.130.0
This collector is now able to accept telemetry via OTLP
Dependencies
If you want to send telemetry data to an OTLP endpoint (like the OpenTelemetry Collector , Jaeger or Prometheus )
You can choose between three different protocols to transport your data:
Protocol
Package
HTTP/protobuf
@opentelemetry/exporter-trace-otlp-proto
HTTP/JSON
@opentelemetry/exporter-trace-otlp-http
gRPC
@opentelemetry/exporter-trace-otlp-grpc
Start by installing the respective exporter packages as a dependency for your project:
1
2
$ npm install --save @opentelemetry/exporter-trace-otlp-proto \ @opentelemetry/exporter-metrics-otlp-proto
1
2
$ npm install --save @opentelemetry/exporter-trace-otlp-http \ @opentelemetry/exporter-metrics-otlp-http
1
2
$ npm install --save @opentelemetry/exporter-trace-otlp-grpc \ @opentelemetry/exporter-metrics-otlp-grpc
Usage with Node.js
Next, configure the exporter to point at an OTLP endpoint.
For example you can update the file instrumentation.ts (or instrumentation.js if you use JavaScript) from the Getting Started like the following to export traces and metrics via OTLP (http/protobuf ) :
1 2 3 4 5 6 7 8 9 10 11 12 13 14 15 16 17 18 19 20 21 22 23 24 25 26 27 28 29 30 31 const opentelemetry = require ('@opentelemetry/sdk-node' );const { getNodeAutoInstrumentations, } = require ('@opentelemetry/auto-instrumentations-node' ); const { OTLPTraceExporter , } = require ('@opentelemetry/exporter-trace-otlp-proto' ); const { OTLPMetricExporter , } = require ('@opentelemetry/exporter-metrics-otlp-proto' ); const { PeriodicExportingMetricReader } = require ('@opentelemetry/sdk-metrics' );const sdk = new opentelemetry.NodeSDK ({ traceExporter : new OTLPTraceExporter ({ url : 'http://localhost:4318/v1/traces' , headers : {}, }), metricReader : new PeriodicExportingMetricReader ({ exporter : new OTLPMetricExporter ({ url : 'http://localhost:4318/v1/metrics' , headers : {}, concurrencyLimit : 1 , }), }), instrumentations : [getNodeAutoInstrumentations ()], }); sdk.start ();
Usage in the Browser
When you use the OTLP exporter in a browser-based application , you need to note that:
Using gRPC for exporting is not supported
Content Security Policies (CSPs) of your website might block your exportsCross-Origin Resource Sharing (CORS) headers might not allow your exports to be sentYou might need to expose your collector to the public internet
Use OTLP exporter with HTTP/JSON or HTTP/protobuf
OpenTelemetry Collector Exporter with gRPC works only with Node.js
therefore you are limited to use the OpenTelemetry Collector Exporter with HTTP/JSON or OpenTelemetry Collector Exporter with HTTP/protobuf .
Make sure that the receiving end of your exporter (collector or observability backend ) accepts http/json if you are using OpenTelemetry Collector Exporter with HTTP/JSON , and that you are exporting your data to the right endpoint with your port set to 4318 .
If your website is making use of Content Security Policies (CSPs), make sure that the domain of your OTLP endpoint is included .
If your collector endpoint is https://collector.example.com:4318/v1/traces
connect-src collector.example.com:4318/v1/traces
If your CSP is not including the OTLP endpoint
you will see an error message , stating that the request to your endpoint is violating the CSP directive .
If your website and collector are hosted at a different origin , your browser might block the requests going out to your collector .
You need to configure special headers for Cross-Origin Resource Sharing (CORS).
The OpenTelemetry Collector provides a feature for http-based receivers
to add the required headers to allow the receiver to accept traces from a web browser :
1
2
3
4
5
6
7
8
9
10
11
12
receivers: otlp: protocols: http: include_metadata: true cors: allowed_origins: - https://foo.bar.com - https://*.test.com allowed_headers: - Example-Header max_age: 7200
Securely expose your collector
To receive telemetry from a web application you need to allow the browsers of your end-users to send data to your collector.
If your web application is accessible from the public internet , you also have to make your collector accessible for everyone .
It is recommended that you do not expose your collector directly , but that you put a reverse proxy (NGINX, Apache HTTP Server, …) in front of it.
The reverse proxy can take care of SSL-offloading , setting the right CORS headers , and many other features specific to web applications.
Below you will find a configuration for the popular NGINX web server to get you started:
1
2
3
4
5
6
7
8
9
10
11
12
13
14
15
16
17
18
19
20
21
22
23
24
25
server { listen 80 default_server; server_name _; location / { if ($request_method = 'OPTIONS' ) { add_header 'Access-Control-Max-Age' 1728000 ; add_header 'Access-Control-Allow-Origin' 'name.of.your.website.example.com' always; add_header 'Access-Control-Allow-Headers' 'Accept,Accept-Language,Content-Language,Content-Type' always; add_header 'Access-Control-Allow-Credentials' 'true' always; add_header 'Content-Type' 'text/plain charset=UTF-8' ; add_header 'Content-Length' 0 ; return 204 ; } add_header 'Access-Control-Allow-Origin' 'name.of.your.website.example.com' always; add_header 'Access-Control-Allow-Credentials' 'true' always; add_header 'Access-Control-Allow-Headers' 'Accept,Accept-Language,Content-Language,Content-Type' always; proxy_http_version 1 .1 ; proxy_set_header Host $host ; proxy_set_header X-Real-IP $remote_addr ; proxy_set_header X-Forwarded-For $proxy_add_x_forwarded_for ; proxy_pass http://collector:4318; } }
Console
To debug your instrumentation or see the values locally in development , you can use exporters writing telemetry data to the console (stdout ).
Batching span and log records
The OpenTelemetry SDK provides a set of default span and log record processors
that allow you to either emit spans one-by-on (“simple ”) or batched .
Using batching is recommended , but if you do not want to batch your spans or log records, you can use a simple processor instead as follows:
1 2 3 4 5 6 7 8 9 10 11 const opentelemetry = require ('@opentelemetry/sdk-node' );const { getNodeAutoInstrumentations, } = require ('@opentelemetry/auto-instrumentations-node' ); const sdk = new opentelemetry.NodeSDK ({ spanProcessors : [new SimpleSpanProcessor (exporter)], instrumentations : [getNodeAutoInstrumentations ()], }); sdk.start ();
Context
OpenTelemetry JavaScript Context API Documentation
In order for OpenTelemetry to work, it must store and propagate important telemetry data.
For example, when a request is received and a span is started it must be available to a component which creates its child span .
To solve this problem, OpenTelemetry stores the span in the Context .
Context Manager
The context API depends on a context manager to work.
Typically the context manager is provided by your SDK , however it is possible to register one directly like this:
1
2
3
4
5
6
import * as api from '@opentelemetry/api' ;import { AsyncHooksContextManager } from '@opentelemetry/context-async-hooks' ;const contextManager = new AsyncHooksContextManager ();contextManager.enable (); api.context .setGlobalContextManager (contextManager);
Root Context
The ROOT_CONTEXT is the empty context .
If no context is active , the ROOT_CONTEXT is active .
Context Keys
Context entries are key-value pairs . Keys can be created by calling api.createContextKey(description) .
1
2
3
4
import * as api from '@opentelemetry/api' ;const key1 = api.createContextKey ('My first key' );const key2 = api.createContextKey ('My second key' );
Basic Operations Get Entry
Entries are accessed using the context.getValue(key) method.
1
2
3
4
5
6
7
import * as api from '@opentelemetry/api' ;const key = api.createContextKey ('some key' );const ctx = api.ROOT_CONTEXT ;const value = ctx.getValue (key);
Set Entry
Copy On Write
Entries are created by using the context.setValue(key, value) method.
Setting a context entry creates a new context with all the entries of the previous context , but with the new entry .
Setting a context entry does not modify the previous context .
1
2
3
4
5
6
7
8
9
10
11
12
13
import * as api from '@opentelemetry/api' ;const key = api.createContextKey ('some key' );const ctx = api.ROOT_CONTEXT ;const ctx2 = ctx.setValue (key, 'context 2' );console .log (ctx2.getValue (key)); console .log (ctx.getValue (key));
Delete Entry
Copy On Write
Entries are removed by calling context.deleteValue(key).
Deleting a context entry creates a new context with all the entries of the previous context , but without the entry identified by the key.
Deleting a context entry does not modify the previous context .
1
2
3
4
5
6
7
8
9
10
11
12
13
14
15
16
import * as api from '@opentelemetry/api' ;const key = api.createContextKey ('some key' );const ctx = api.ROOT_CONTEXT ;const ctx2 = ctx.setValue (key, 'context 2' );const ctx3 = ctx.deleteValue (key);console .log (ctx3.getValue (key)); console .log (ctx2.getValue (key)); console .log (ctx.getValue (key));
Active Context
IMPORTANT: This assumes you have configured a Context Manager. Without one, api.context.active() will ALWAYS return the ROOT_CONTEXT .
The active context is the context which is returned by api.context.active() .
The context object contains entries which allow tracing components which are tracing a single thread of execution
to communicate with each other and ensure the trace is successfully created.
For example, when a span is created it may be added to the context .
Later, when another span is created it may use the span from the context as its parent span .
This is accomplished through the use of mechanisms like async_hooks or AsyncLocalStorage in node, or zone.js on the web
in order to propagate the context through a single execution .
If no context is active , the ROOT_CONTEXT is returned, which is just the empty context object.
Propagation
Context propagation for the JS SDK
With context propagation , Signals can be correlated with each other, regardless of where they are generated.
Although not limited to tracing
context propagation allows traces to build causal information about a system across services that are arbitrarily distributed across process and network boundaries.
For the vast majority of use cases
libraries that natively support OpenTelemetry or instrumentation libraries will automatically propagate trace context across services for you.
It is only in rare cases that you will need to propagate context manually .
Automatic context propagation Instrumentation libraries like @opentelemetry/instrumentation-http or @opentelemetry/instrumentation-express propagate context across services
Start by creating a new folder called dice-client and install the required dependencies:
1
2
3
4
$ npm init -y npm install undici \ @opentelemetry/instrumentation-undici \ @opentelemetry/sdk-node
Next, create a new file called client.ts (or client.js) with the following content:
1
2
3
4
5
6
7
8
9
10
11
12
13
14
15
16
17
18
19
20
const { NodeSDK } = require ('@opentelemetry/sdk-node' );const { SimpleSpanProcessor , ConsoleSpanExporter , } = require ('@opentelemetry/sdk-trace-node' ); const { UndiciInstrumentation , } = require ('@opentelemetry/instrumentation-undici' ); const sdk = new NodeSDK ({ spanProcessors : [new SimpleSpanProcessor (new ConsoleSpanExporter ())], instrumentations : [new UndiciInstrumentation ()], }); sdk.start (); const { request } = require ('undici' );request ('http://localhost:8080/rolldice' ).then ((response ) => { response.body .json ().then ((json ) => console .log (json)); });
Make sure that you have the instrumented version of app.ts (or app.js) from the Getting Started running in one shell:
1
2
$ node --require ./instrumentation.js app.js Listening for requests on http://localhost:8080
Start a second shell and run the client.ts (or client.js):
Both shells should emit span details to the console. The client output looks similar to the following:
1
2
3
4
5
6
7
8
9
10
11
12
13
14
15
16
17
18
19
20
21
22
23
24
25
26
27
28
29
30
31
32
33
34
35
36
37
38
39
40
41
42
43
44
45
46
47
48
49
50
51
52
53
54
55
{ resource: { attributes: { 'host.name': 'macos.local', 'host.arch': 'arm64', 'host.id': '359031 FF-956E-5 B48-89 FD-8 A78A79AE606', 'process.pid': 11706 , 'process.executable.name': '/Users/zhongmingmao/.asdf/installs/nodejs/22.17 .1 /bin/node', 'process.executable.path': '/Users/zhongmingmao/.asdf/installs/nodejs/22.17 .1 /bin/node', 'process.command_args': [ '/Users/zhongmingmao/.asdf/installs/nodejs/22.17 .1 /bin/node', '/Users/zhongmingmao/workspace/o11y/demo/voyager-o11y-demo-js-nodejs-client/client.js' ] , 'process.runtime.version': '22.17 .1 ', 'process.runtime.name': 'nodejs', 'process.runtime.description': 'Node.js', 'process.command': '/Users/zhongmingmao/workspace/o11y/demo/voyager-o11y-demo-js-nodejs-client/client.js', 'process.owner': 'zhongmingmao', 'service.name': 'unknown_service: /Users/zhongmingmao/.asdf/installs/nodejs/22.17 .1 /bin/node', 'telemetry.sdk.language': 'nodejs', 'telemetry.sdk.name': 'opentelemetry', 'telemetry.sdk.version': '2.0 .1 ' } } , instrumentationScope: { name: '@opentelemetry/instrumentation-undici', version: '0.14 .0 ', schemaUrl: undefined } , traceId: 'a791aae12c1bfc6264884fde5c42be29', parentSpanContext: undefined, traceState: undefined, name: 'GET', id: '6 db7a93cbaa5dfb1', kind: 2 , timestamp: 1753012207997000 , duration: 20464.958 , attributes: { 'http.request.method': 'GET', 'http.request.method_original': 'GET', 'url.full': 'http: 'url.path': '/rolldice', 'url.query': '', 'url.scheme': 'http', 'server.address': 'localhost', 'server.port': 8080 , 'network.peer.address': ': : 1 ', 'network.peer.port': 8080 , 'http.response.status_code': 200 , 'http.response.header.content-length': 1 } , status: { code: 0 } , events: [ ] , links: [ ] }
Your client and server application successfully report connected spans .
If you send both to a backend now the visualization will show this dependency for you.
Resources
Add details about your applications’ environment to your telemetry
A resource represents the entity producing telemetry as resource attributes.
For example, a process producing telemetry that is running in a container on Kubernetes
has a process name , a pod name , a namespace , and possibly a deployment name .
All four of these attributes can be included in the resource .
In your observability backend , you can use resource information to better investigate interesting behavior
For example, if your trace or metrics data indicate latency in your system, you can narrow it down to a specific container, pod, or Kubernetes deployment.
Below you will find introductions on how to set up resource detection with the Node.js SDK .
Sampling
Reduce the amount of telemetry created
Sampling is a process that restricts the amount of traces that are generated by a system. The JavaScript SDK offers several head samplers .
Default behavior By default, all spans are sampled, and thus, 100% of traces are sampled. If you do not need to manage data volume, don’t bother setting a sampler.
TraceIDRatioBasedSampler
When sampling, the most common head sampler to use is the TraceIdRatioBasedSampler .
It deterministically samples a percentage of traces that you pass in as a parameter.
Environment Variables
You can configure the TraceIdRatioBasedSampler with environment variables
This tells the SDK to sample spans such that only 10% of traces get created .
1
2
export OTEL_TRACES_SAMPLER="traceidratio" export OTEL_TRACES_SAMPLER_ARG="0.1"
Node.js 1 2 3 4 5 6 7 8 const { TraceIdRatioBasedSampler } = require ('@opentelemetry/sdk-trace-node' );const samplePercentage = 0.1 ;const sdk = new NodeSDK ({ sampler : new TraceIdRatioBasedSampler (samplePercentage), });
Browser 1 2 3 4 5 6 7 8 9 10 const { WebTracerProvider , TraceIdRatioBasedSampler , } = require ('@opentelemetry/sdk-trace-web' ); const samplePercentage = 0.1 ;const provider = new WebTracerProvider ({ sampler : new TraceIdRatioBasedSampler (samplePercentage), });