Overview

Status and Releases

The logs signal is still experimental. Breaking changes may be introduced in future versions.

Traces Metrics Logs
Stable Stable Beta

Getting Started

Example application

Setup

To begin, set up a go.mod in a new directory:

1
2
3
4
5
$ go mod init dice
go: creating new go.mod: module dice

$ ls
go.mod

Create and launch an HTTP server

In that same folder, create a file called main.go and add the following code to the file:

1
2
3
4
5
6
7
8
9
10
11
12
package main

import (
"log"
"net/http"
)

func main() {
http.HandleFunc("/rolldice", rolldice)

log.Fatal(http.ListenAndServe(":8080", nil))
}

Create another file called rolldice.go and add the following code to the file:

1
2
3
4
5
6
7
8
9
10
11
12
13
14
15
16
17
18
package main

import (
"io"
"log"
"math/rand"
"net/http"
"strconv"
)

func rolldice(w http.ResponseWriter, r *http.Request) {
roll := 1 + rand.Intn(6)

resp := strconv.Itoa(roll) + "\n"
if _, err := io.WriteString(w, resp); err != nil {
log.Printf("Write failed: %v\n", err)
}
}

Build and run the application with the following command:

1
$ go run .

Open http://localhost:8080/rolldice in your web browser to ensure it is working.

Add OpenTelemetry Instrumentation

Add Dependencies

Install the following packages - This installs OpenTelemetry SDK components and net/http instrumentation.

1
2
3
4
5
6
7
8
9
10
11
12
$ go get "go.opentelemetry.io/otel" \
"go.opentelemetry.io/otel/exporters/stdout/stdoutmetric" \
"go.opentelemetry.io/otel/exporters/stdout/stdouttrace" \
"go.opentelemetry.io/otel/exporters/stdout/stdoutlog" \
"go.opentelemetry.io/otel/sdk/log" \
"go.opentelemetry.io/otel/log/global" \
"go.opentelemetry.io/otel/propagation" \
"go.opentelemetry.io/otel/sdk/metric" \
"go.opentelemetry.io/otel/sdk/resource" \
"go.opentelemetry.io/otel/sdk/trace" \
"go.opentelemetry.io/contrib/instrumentation/net/http/otelhttp"\
"go.opentelemetry.io/contrib/bridges/otelslog"

Initialize the OpenTelemetry SDK

First, we’ll initialize the OpenTelemetry SDK. This is required for any application that exports telemetry.
Create otel.go with OpenTelemetry SDK bootstrapping code

1
2
3
4
5
6
7
8
9
10
11
12
13
14
15
16
17
18
19
20
21
22
23
24
25
26
27
28
29
30
31
32
33
34
35
36
37
38
39
40
41
42
43
44
45
46
47
48
49
50
51
52
53
54
55
56
57
58
59
60
61
62
63
64
65
66
67
68
69
70
71
72
73
74
75
76
77
78
79
80
81
82
83
84
85
86
87
88
89
90
91
92
93
94
95
96
97
98
99
100
101
102
103
104
105
106
107
108
109
110
111
112
113
114
115
116
117
118
119
120
121
package main

import (
"context"
"errors"
"time"

"go.opentelemetry.io/otel"
"go.opentelemetry.io/otel/exporters/stdout/stdoutlog"
"go.opentelemetry.io/otel/exporters/stdout/stdoutmetric"
"go.opentelemetry.io/otel/exporters/stdout/stdouttrace"
"go.opentelemetry.io/otel/log/global"
"go.opentelemetry.io/otel/propagation"
"go.opentelemetry.io/otel/sdk/log"
"go.opentelemetry.io/otel/sdk/metric"
"go.opentelemetry.io/otel/sdk/trace"
)

// setupOTelSDK bootstraps the OpenTelemetry pipeline.
// If it does not return an error, make sure to call shutdown for proper cleanup.
func setupOTelSDK(ctx context.Context) (shutdown func(context.Context) error, err error) {
var shutdownFuncs []func(context.Context) error

// shutdown calls cleanup functions registered via shutdownFuncs.
// The errors from the calls are joined.
// Each registered cleanup will be invoked once.
shutdown = func(ctx context.Context) error {
var err error
for _, fn := range shutdownFuncs {
err = errors.Join(err, fn(ctx))
}
shutdownFuncs = nil
return err
}

// handleErr calls shutdown for cleanup and makes sure that all errors are returned.
handleErr := func(inErr error) {
err = errors.Join(inErr, shutdown(ctx))
}

// Set up propagator.
prop := newPropagator()
otel.SetTextMapPropagator(prop)

// Set up trace provider.
tracerProvider, err := newTracerProvider()
if err != nil {
handleErr(err)
return
}
shutdownFuncs = append(shutdownFuncs, tracerProvider.Shutdown)
otel.SetTracerProvider(tracerProvider)

// Set up meter provider.
meterProvider, err := newMeterProvider()
if err != nil {
handleErr(err)
return
}
shutdownFuncs = append(shutdownFuncs, meterProvider.Shutdown)
otel.SetMeterProvider(meterProvider)

// Set up logger provider.
loggerProvider, err := newLoggerProvider()
if err != nil {
handleErr(err)
return
}
shutdownFuncs = append(shutdownFuncs, loggerProvider.Shutdown)
global.SetLoggerProvider(loggerProvider)

return
}

func newPropagator() propagation.TextMapPropagator {
return propagation.NewCompositeTextMapPropagator(
propagation.TraceContext{},
propagation.Baggage{},
)
}

func newTracerProvider() (*trace.TracerProvider, error) {
traceExporter, err := stdouttrace.New(
stdouttrace.WithPrettyPrint())
if err != nil {
return nil, err
}

tracerProvider := trace.NewTracerProvider(
trace.WithBatcher(traceExporter,
// Default is 5s. Set to 1s for demonstrative purposes.
trace.WithBatchTimeout(time.Second)),
)
return tracerProvider, nil
}

func newMeterProvider() (*metric.MeterProvider, error) {
metricExporter, err := stdoutmetric.New()
if err != nil {
return nil, err
}

meterProvider := metric.NewMeterProvider(
metric.WithReader(metric.NewPeriodicReader(metricExporter,
// Default is 1m. Set to 3s for demonstrative purposes.
metric.WithInterval(3*time.Second))),
)
return meterProvider, nil
}

func newLoggerProvider() (*log.LoggerProvider, error) {
logExporter, err := stdoutlog.New()
if err != nil {
return nil, err
}

loggerProvider := log.NewLoggerProvider(
log.WithProcessor(log.NewBatchProcessor(logExporter)),
)
return loggerProvider, nil
}

If you’re only using tracing or metrics, you can omit the corresponding TracerProvider or MeterProvider initialization code.

Instrument the HTTP server

  1. Now that we have the OpenTelemetry SDK initialized, we can instrument the HTTP server.
  2. Modify main.go to include code that sets up OpenTelemetry SDK and instruments the HTTP server using the otelhttp instrumentation library:
1
2
3
4
5
6
7
8
9
10
11
12
13
14
15
16
17
18
19
20
21
22
23
24
25
26
27
28
29
30
31
32
33
34
35
36
37
38
39
40
41
42
43
44
45
46
47
48
49
50
51
52
53
54
55
56
57
58
59
60
61
62
63
64
65
66
67
68
69
70
71
72
73
74
75
76
77
78
79
80
81
82
83
84
package main

import (
"context"
"errors"
"log"
"net"
"net/http"
"os"
"os/signal"
"time"

"go.opentelemetry.io/contrib/instrumentation/net/http/otelhttp"
)

func main() {
if err := run(); err != nil {
log.Fatalln(err)
}
}

func run() (err error) {
// Handle SIGINT (CTRL+C) gracefully.
ctx, stop := signal.NotifyContext(context.Background(), os.Interrupt)
defer stop()

// Set up OpenTelemetry.
otelShutdown, err := setupOTelSDK(ctx)
if err != nil {
return
}
// Handle shutdown properly so nothing leaks.
defer func() {
err = errors.Join(err, otelShutdown(context.Background()))
}()

// Start HTTP server.
srv := &http.Server{
Addr: ":8080",
BaseContext: func(_ net.Listener) context.Context { return ctx },
ReadTimeout: time.Second,
WriteTimeout: 10 * time.Second,
Handler: newHTTPHandler(),
}
srvErr := make(chan error, 1)
go func() {
srvErr <- srv.ListenAndServe()
}()

// Wait for interruption.
select {
case err = <-srvErr:
// Error when starting HTTP server.
return
case <-ctx.Done():
// Wait for first CTRL+C.
// Stop receiving signal notifications as soon as possible.
stop()
}

// When Shutdown is called, ListenAndServe immediately returns ErrServerClosed.
err = srv.Shutdown(context.Background())
return
}

func newHTTPHandler() http.Handler {
mux := http.NewServeMux()

// handleFunc is a replacement for mux.HandleFunc
// which enriches the handler's HTTP instrumentation with the pattern as the http.route.
handleFunc := func(pattern string, handlerFunc func(http.ResponseWriter, *http.Request)) {
// Configure the "http.route" for the HTTP instrumentation.
handler := otelhttp.WithRouteTag(pattern, http.HandlerFunc(handlerFunc))
mux.Handle(pattern, handler)
}

// Register handlers.
handleFunc("/rolldice/", rolldice)
handleFunc("/rolldice/{player}", rolldice)

// Add HTTP instrumentation for the whole server.
handler := otelhttp.NewHandler(mux, "/")
return handler
}

Add Custom Instrumentation

  1. Instrumentation libraries capture telemetry at the edges of your systems
    • such as inbound and outbound HTTP requests, but they don’t capture what’s going on in your application.
    • For that you’ll need to write some custom manual instrumentation.
  2. Modify rolldice.go to include custom instrumentation using OpenTelemetry API:
1
2
3
4
5
6
7
8
9
10
11
12
13
14
15
16
17
18
19
20
21
22
23
24
25
26
27
28
29
30
31
32
33
34
35
36
37
38
39
40
41
42
43
44
45
46
47
48
49
50
51
52
53
54
55
56
57
58
package main

import (
"fmt"
"io"
"log"
"math/rand"
"net/http"
"strconv"

"go.opentelemetry.io/contrib/bridges/otelslog"
"go.opentelemetry.io/otel"
"go.opentelemetry.io/otel/attribute"
"go.opentelemetry.io/otel/metric"
)

const name = "go.opentelemetry.io/otel/example/dice"

var (
tracer = otel.Tracer(name)
meter = otel.Meter(name)
logger = otelslog.NewLogger(name)
rollCnt metric.Int64Counter
)

func init() {
var err error
rollCnt, err = meter.Int64Counter("dice.rolls",
metric.WithDescription("The number of rolls by roll value"),
metric.WithUnit("{roll}"))
if err != nil {
panic(err)
}
}

func rolldice(w http.ResponseWriter, r *http.Request) {
ctx, span := tracer.Start(r.Context(), "roll")
defer span.End()

roll := 1 + rand.Intn(6)

var msg string
if player := r.PathValue("player"); player != "" {
msg = fmt.Sprintf("%s is rolling the dice", player)
} else {
msg = "Anonymous player is rolling the dice"
}
logger.InfoContext(ctx, msg, "result", roll)

rollValueAttr := attribute.Int("roll.value", roll)
span.SetAttributes(rollValueAttr)
rollCnt.Add(ctx, 1, metric.WithAttributes(rollValueAttr))

resp := strconv.Itoa(roll) + "\n"
if _, err := io.WriteString(w, resp); err != nil {
log.Printf("Write failed: %v\n", err)
}
}

Run the Application

Build and run the application with the following command:

1
2
3
go mod tidy
export OTEL_RESOURCE_ATTRIBUTES="service.name=dice,service.version=0.1.0"
go run .
  1. Open http://localhost:8080/rolldice/Alice in your web browser
    • When you send a request to the server, you’ll see two spans in the trace emitted to the console.
    • The span generated by the instrumentation library tracks the lifetime of a request to the /rolldice/{player} route.
    • The span called roll is created manually and it is a child of the previously mentioned span.
  2. Along with the trace, log messages are emitted to the console.
  3. Refresh the http://localhost:8080/rolldice/Alice page a few times
    • and then either wait a little or terminate the app and you’ll see metrics as in the console output
    • You’ll see the dice.rolls metric emitted to the console, with separate counts for each roll value
    • as well as the HTTP metrics generated by the instrumentation library.

Instrumentation

Overview

Manual instrumentation for OpenTelemetry Go

  1. Instrumentation is the act of adding observability code to an app yourself.
  2. If you’re instrumenting an app, you need to use the OpenTelemetry SDK for your language.
    • You’ll then use the SDK to initialize OpenTelemetry and the API to instrument your code
    • This will emit telemetry from your app, and any library you installed that also comes with instrumentation.
  3. If you’re instrumenting a library, only install the OpenTelemetry API package for your language.
    • Your library will not emit telemetry on its own
    • It will only emit telemetry when it is part of an app that uses the OpenTelemetry SDK

Traces

Getting a Tracer

To create spans, you’ll need to acquire or initialize a tracer first. - Ensure you have the right packages installed:

1
2
3
go get go.opentelemetry.io/otel \
go.opentelemetry.io/otel/trace \
go.opentelemetry.io/otel/sdk \

Then initialize an exporter, resources, tracer provider, and finally a tracer.

1
2
3
4
5
6
7
8
9
10
11
12
13
14
15
16
17
18
19
20
21
22
23
24
25
26
27
28
29
30
31
32
33
34
35
36
37
38
39
40
41
42
43
44
45
46
47
48
49
50
51
52
53
54
55
56
57
58
59
package app

import (
"context"
"fmt"
"log"

"go.opentelemetry.io/otel"
"go.opentelemetry.io/otel/sdk/resource"
sdktrace "go.opentelemetry.io/otel/sdk/trace"
semconv "go.opentelemetry.io/otel/semconv/v1.34.0"
"go.opentelemetry.io/otel/trace"
)

var tracer trace.Tracer

func newExporter(ctx context.Context) /* (someExporter.Exporter, error) */ {
// Your preferred exporter: console, jaeger, zipkin, OTLP, etc.
}

func newTracerProvider(exp sdktrace.SpanExporter) *sdktrace.TracerProvider {
// Ensure default SDK resources and the required service name are set.
r, err := resource.Merge(
resource.Default(),
resource.NewWithAttributes(
semconv.SchemaURL,
semconv.ServiceName("ExampleService"),
),
)

if err != nil {
panic(err)
}

return sdktrace.NewTracerProvider(
sdktrace.WithBatcher(exp),
sdktrace.WithResource(r),
)
}

func main() {
ctx := context.Background()

exp, err := newExporter(ctx)
if err != nil {
log.Fatalf("failed to initialize exporter: %v", err)
}

// Create a new tracer provider with a batch span processor and the given exporter.
tp := newTracerProvider(exp)

// Handle shutdown properly so nothing leaks.
defer func() { _ = tp.Shutdown(ctx) }()

otel.SetTracerProvider(tp)

// Finally, set the tracer that can be used for this package.
tracer = tp.Tracer("example.io/package/name")
}

You can now access tracer to manually instrument your code.

Creating Spans

  1. Spans are created by tracers. If you don’t have one initialized, you’ll need to do that.
  2. To create a span with a tracer, you’ll also need a handle on a context.Context instance.
    • These will typically come from things like a request object and may already contain a parent span from an instrumentation library.
  3. In Go, the context package is used to store the active span.
    • When you start a span, you’ll get a handle on not only the span that’s created, but the modified context that contains it.
    • Once a span has completed, it is immutable and can no longer be modified.
1
2
3
4
5
6
func httpHandler(w http.ResponseWriter, r *http.Request) {
ctx, span := tracer.Start(r.Context(), "hello-span")
defer span.End()

// do some work to track with hello-span
}

Get the current span

To get the current span, you’ll need to pull it out of a context.Context you have a handle on:

1
2
3
4
5
// This context needs contain the active span you plan to extract.
ctx := context.TODO()
span := trace.SpanFromContext(ctx)

// Do something with the current span, optionally calling `span.End()` if you want it to end

This can be helpful if you’d like to add information to the current span at a point in time.

Create nested spans

  1. You can create a nested span to track work in a nested operation.
  2. If the current context.Context you have a handle on already contains a span inside of it, creating a new span makes it a nested span. For example:
1
2
3
4
5
6
7
8
9
10
11
12
13
14
15
16
17
func parentFunction(ctx context.Context) {
ctx, parentSpan := tracer.Start(ctx, "parent")
defer parentSpan.End()

// call the child function and start a nested span in there
childFunction(ctx)

// do more work - when this function ends, parentSpan will complete.
}

func childFunction(ctx context.Context) {
// Create a span to track `childFunction()` - this is a nested span whose parent is `parentSpan`
ctx, childSpan := tracer.Start(ctx, "child")
defer childSpan.End()

// do work here, when this function returns, childSpan will complete.
}

Once a span has completed, it is immutable and can no longer be modified.

Span Attributes

  1. Attributes are keys and values that are applied as metadata to your spans and are useful for aggregating, filtering, and grouping traces.
  2. Attributes can be added at span creation, or at any other time during the lifecycle of a span before it has completed.
1
2
3
4
// setting attributes at creation...
ctx, span = tracer.Start(ctx, "attributesAtCreation", trace.WithAttributes(attribute.String("hello", "world")))
// ... and after creation
span.SetAttributes(attribute.Bool("isTrue", true), attribute.String("stringAttr", "hi!"))

Attribute keys can be precomputed, as well:

1
2
var myKey = attribute.Key("myCoolAttribute")
span.SetAttributes(myKey.String("a value"))

Semantic Attributes

  1. Semantic Attributes are attributes that are defined by the OpenTelemetry Specification
  2. in order to provide a shared set of attribute keys across multiple languages, frameworks, and runtimes for common concepts
    • like HTTP methods, status codes, user agents, and more.

Events

An event is a human-readable message on a span that represents “something happening” during it’s lifetime.

1
2
3
4
5
6
span.AddEvent("Acquiring lock")
mutex.Lock()
span.AddEvent("Got lock, doing work...")
// do stuff
span.AddEvent("Unlocking")
mutex.Unlock()
  1. A useful characteristic of events is that their timestamps are displayed as offsets from the beginning of the span
  2. allowing you to easily see how much time elapsed between them.

Events can also have attributes of their own

1
span.AddEvent("Cancelled wait due to external signal", trace.WithAttributes(attribute.Int("pid", 4328), attribute.String("signal", "SIGHUP")))

Set span status

  1. A Status can be set on a Span, typically used to specify that a Span has not completed successfully - Error.
  2. By default, all spans are Unset, which means a span completed without error.

The status can be set at any time before the span is finished.

1
2
3
4
5
6
7
8
9
10
11
12
import (
// ...
"go.opentelemetry.io/otel/codes"
// ...
)

// ...

result, err := operationThatCouldFail()
if err != nil {
span.SetStatus(codes.Error, "operationThatCouldFail failed")
}

Record errors

If you have an operation that failed and you wish to capture the error it produced, you can record that error. - Stack

1
2
3
4
5
6
7
8
9
10
11
12
13
import (
// ...
"go.opentelemetry.io/otel/codes"
// ...
)

// ...

result, err := operationThatCouldFail()
if err != nil {
span.SetStatus(codes.Error, "operationThatCouldFail failed")
span.RecordError(err)
}
  1. It is highly recommended that you also set a span’s status to Error when using RecordError
    • unless you do not wish to consider the span tracking a failed operation as an error span.
  2. The RecordError function does not automatically set a span status when called.

Propagators and Context

  1. Traces can extend beyond a single process.
  2. This requires context propagation, a mechanism where identifiers for a trace are sent to remote processes

In order to propagate trace context over the wire, a propagator must be registered with the OpenTelemetry API.

1
2
3
4
5
6
import (
"go.opentelemetry.io/otel"
"go.opentelemetry.io/otel/propagation"
)
...
otel.SetTextMapPropagator(propagation.TraceContext{})
  1. OpenTelemetry also supports the B3 header format, for compatibility with existing tracing systems (go.opentelemetry.io/contrib/propagators/b3)
  2. that do not support the W3C TraceContext standard.

Libraries

  1. When you develop an app, you might use third-party libraries and frameworks to accelerate your work.
  2. If you then instrument your app using OpenTelemetry, you might want to
    • avoid spending additional time to manually add traces, logs, and metrics to the third-party libraries and frameworks you use.
  3. Many libraries and frameworks already support OpenTelemetry or are supported through OpenTelemetry instrumentation
    • so that they can generate telemetry you can export to an observability back end.

Use natively instrumented libraries

As of today, we don’t know about any Go library that has OpenTelemetry natively integrated.

  1. If a library comes with OpenTelemetry support by default
    • you can get traces, metrics, and logs emitted from that library by adding and setting up the OpenTelemetry SDK with your app.
  2. The library might require some additional configuration for the instrumentation.

Use instrumentation libraries

  1. If a library does not come with OpenTelemetry out of the box, you can use instrumentation libraries to generate telemetry data for a library or framework.
  2. For example, the instrumentation library for net/http automatically creates spans and metrics based on the HTTP requests.

Each instrumentation library is a package. In general, this means you need to go get the appropriate package.

1
go get go.opentelemetry.io/contrib/instrumentation/{import-path}/otel{package-name}
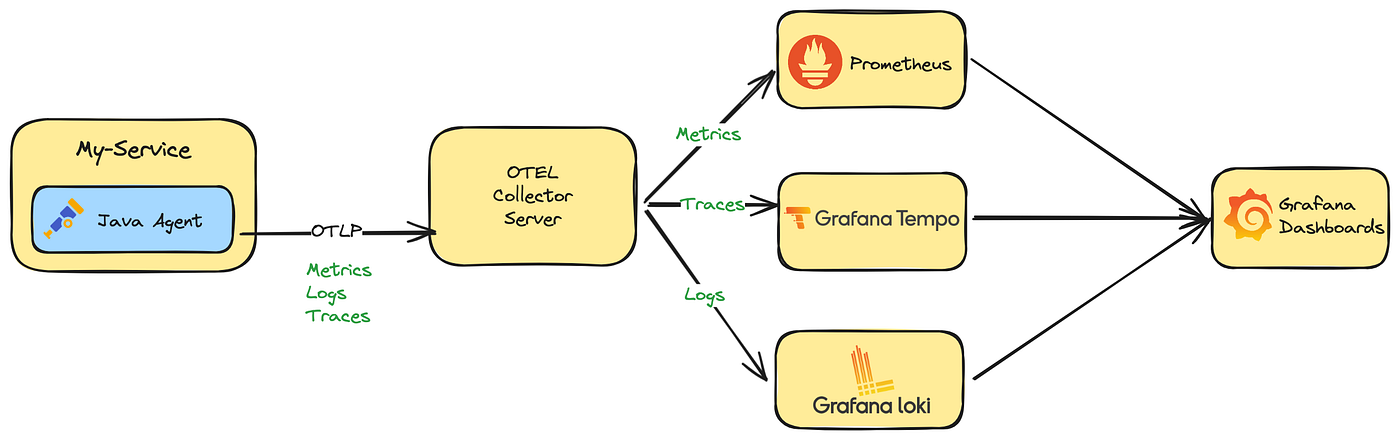
Exporters

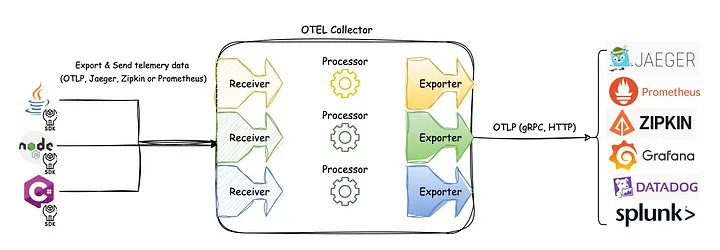
  1. Send telemetry to the OpenTelemetry Collector to make sure it’s exported correctly.
    • Using the Collector in production environments is a best practice.
  2. To visualize your telemetry, export it to a backend such as Jaeger, Zipkin, Prometheus, or a vendor-specific backend.

Available exporters

  1. Among exporters, OpenTelemetry Protocol (OTLP) exporters are designed with the OpenTelemetry data model in mind
    • emitting OTel data without any loss of information.
  2. Furthermore, many tools that operate on telemetry data support OTLP (such as Prometheus, Jaeger, and most vendors)
    • providing you with a high degree of flexibility when you need it.

OTLP

To send trace data to an OTLP endpoint (like the collector or Jaeger >= v1.35.0) you’ll want to configure an OTLP exporter that sends to your endpoint.

OTLP traces over HTTP

  1. go.opentelemetry.io/otel/exporters/otlp/otlptrace/otlptracehttp
  2. contains an implementation of the OTLP trace exporter using HTTP with binary protobuf payloads

OTLP traces over gRPC

  1. go.opentelemetry.io/otel/exporters/otlp/otlptrace/otlptracegrpc
  2. contains an implementation of OTLP trace exporter using gRPC

Jaeger

To try out the OTLP exporter, since v1.35.0 you can run Jaeger as an OTLP endpoint and for trace visualization in a Docker container:

OTLP metrics over HTTP

  1. go.opentelemetry.io/otel/exporters/otlp/otlpmetric/otlpmetrichttp
  2. contains an implementation of OTLP metrics exporter using HTTP with binary protobuf payloads

OTLP metrics over gRPC

  1. go.opentelemetry.io/otel/exporters/otlp/otlpmetric/otlpmetricgrpc
  2. contains an implementation of OTLP metrics exporter using gRPC

Resources

  1. A resource represents the entity producing telemetry as resource attributes.
  2. In your observability backend, you can use resource information to better investigate interesting behavior.

Resources should be assigned to a tracer, meter, and logger provider at its initialization, and are created much like attributes:

1
2
3
4
5
6
7
8
9
10
11
res := resource.NewWithAttributes(
semconv.SchemaURL,
semconv.ServiceNameKey.String("myService"),
semconv.ServiceVersionKey.String("1.0.0"),
semconv.ServiceInstanceIDKey.String("abcdef12345"),
)

provider := sdktrace.NewTracerProvider(
...
sdktrace.WithResource(res),
)
  1. Note the use of the semconv package to provide conventional names for resource attributes.
  2. This helps ensure that consumers of telemetry produced with these semantic conventions
    • can easily discover relevant attributes and understand their meaning.

Resources can also be detected automatically through resource.Detector implementations.

  1. These Detectors may discover information about
  2. the currently running process
  3. the operating system it is running on
  4. the cloud provider hosting that operating system instance
  5. or any number of other resource attributes.
1
2
3
4
5
6
7
8
9
10
11
12
13
14
15
16
res, err := resource.New(
context.Background(),
resource.WithFromEnv(), // Discover and provide attributes from OTEL_RESOURCE_ATTRIBUTES and OTEL_SERVICE_NAME environment variables.
resource.WithTelemetrySDK(), // Discover and provide information about the OpenTelemetry SDK used.
resource.WithProcess(), // Discover and provide process information.
resource.WithOS(), // Discover and provide OS information.
resource.WithContainer(), // Discover and provide container information.
resource.WithHost(), // Discover and provide host information.
resource.WithAttributes(attribute.String("foo", "bar")), // Add custom resource attributes.
// resource.WithDetectors(thirdparty.Detector{}), // Bring your own external Detector implementation.
)
if errors.Is(err, resource.ErrPartialResource) || errors.Is(err, resource.ErrSchemaURLConflict) {
log.Println(err) // Log non-fatal issues.
} else if err != nil {
log.Fatalln(err) // The error may be fatal.
}

Sampling

  1. Sampling is a process that restricts the amount of spans that are generated by a system.
  2. The exact sampler you should use depends on your specific needs
    • but in general you should make a decision at the start of a trace, and allow the sampling decision to propagate to other services.

A Sampler can be set on the tracer provider using the WithSampler option, as follows:

1
2
3
provider := trace.NewTracerProvider(
trace.WithSampler(trace.AlwaysSample()),
)
  1. AlwaysSample and NeverSample are self-explanatory values.
    • AlwaysSample means that every span is sampled, while NeverSample means that no span is sampled
  2. Other samplers include
    • TraceIDRatioBased
      • which samples a fraction of spans, based on the fraction given to the sampler.
      • If you set .5, half of all the spans are sampled.
    • ParentBased
      • is a sampler decorator which behaves differently, based on the parent of the span.
      • If the span has no parent, the decorated sampler is used to make sampling decision based on the parent of the span.
      • By default, ParentBased samples spans that have parents that were sampled, and doesn’t sample spans whose parents were not sampled.
  3. By default, the tracer provider uses a ParentBased sampler with the AlwaysSample sampler.
  4. When in a production environment, consider using the ParentBased sampler with the TraceIDRatioBased sampler.