Observability - OpenTelemetry Python
Overview
Status and Releases
| Traces | Metrics | Logs |
|---|---|---|
| Stable | Stable | Development |
Version support
OpenTelemetry-Python supports Python 3.9 and higher.
Installation
The API and SDK packages are available on PyPI, and can be installed via pip:
1 | pip install opentelemetry-api |
In addition, there are several extension packages which can be installed separately as:
1 | pip install opentelemetry-exporter-{exporter} |
- These are for exporter and instrumentation libraries respectively.
- The Jaeger, Zipkin, Prometheus, OTLP and OpenCensus Exporters can be found in the exporter directory of the repository.
- Instrumentations and additional exporters can be found in the contrib repository instrumentation and exporter directories.
Getting Started
Example Application
- The following example uses a basic Flask application.
- You can use OpenTelemetry Python with other web frameworks as well, such as Django and FastAPI.
Installation
To begin, set up an environment in a new directory:
1 | mkdir otel-getting-started |
Now install Flask:
1 | pip install flask |
Create and launch an HTTP Server
Create a file
app.pyand add the following code to it:
1 | from random import randint |
Run the application with the following command and open http://localhost:8080/rolldice in your web browser to ensure it is working.
1 | flask run -p 8080 |
Instrumentation
- Zero-code instrumentation will generate telemetry data on your behalf.
- There are several options you can take, Here we’ll use the opentelemetry-instrument agent.
- Install the opentelemetry-distro package
- which contains the OpenTelemetry API, SDK and also the tools opentelemetry-bootstrap and opentelemetry-instrument you will use below.
1 | pip install opentelemetry-distro |
Run the
opentelemetry-bootstrapcommand:
1 | opentelemetry-bootstrap -a install |
This will install Flask instrumentation.
Run the instrumented app
You can now run your instrumented app with opentelemetry-instrument and have it print to the console for now:
1 | export OTEL_PYTHON_LOGGING_AUTO_INSTRUMENTATION_ENABLED=true |
Open http://localhost:8080/rolldice in your web browser and reload the page a few times.
After a while you should see the spans printed in the console, such as the following:
1 | { |
- The generated span tracks the lifetime of a request to the
/rolldiceroute. - The log line emitted during the request contains the same trace ID and span ID and is exported to the console via the log exporter.
- Send a few more requests to the endpoint, and then either wait for a little bit or terminate the app and you’ll see metrics in the console output
1 | { |
Add manual instrumentation to automatic instrumentation
- Automatic instrumentation captures telemetry at the edges of your systems
- such as inbound and outbound HTTP requests, but it doesn’t capture what’s going on in your application.
- For that you’ll need to write some manual instrumentation.
Traces
First, modify
app.pyto include code that initializes a tracer and uses it to create a trace that’s a child of the one that’s automatically generated:
1 | from random import randint |
Now run the app again:
1 | pip install opentelemetry-exporter-otlp opentelemetry-exporter-otlp-proto-grpc |
1 | export OTEL_PYTHON_LOGGING_AUTO_INSTRUMENTATION_ENABLED=true |
When you send a request to the server, you’ll see two spans in the trace emitted to the console
and the one calledrollregisters its parent as the automatically created one:
1 | { |
The parent_id of roll is the same as the span_id for /rolldice, indicating a parent-child relationship!
Metrics
Now modify app.py to include code that initializes a meter and uses it to create a counter instrument which counts the number of rolls for each possible roll value:
1 | # These are the necessary import declarations |
Now run the app again:
1 | export OTEL_PYTHON_LOGGING_AUTO_INSTRUMENTATION_ENABLED=true |
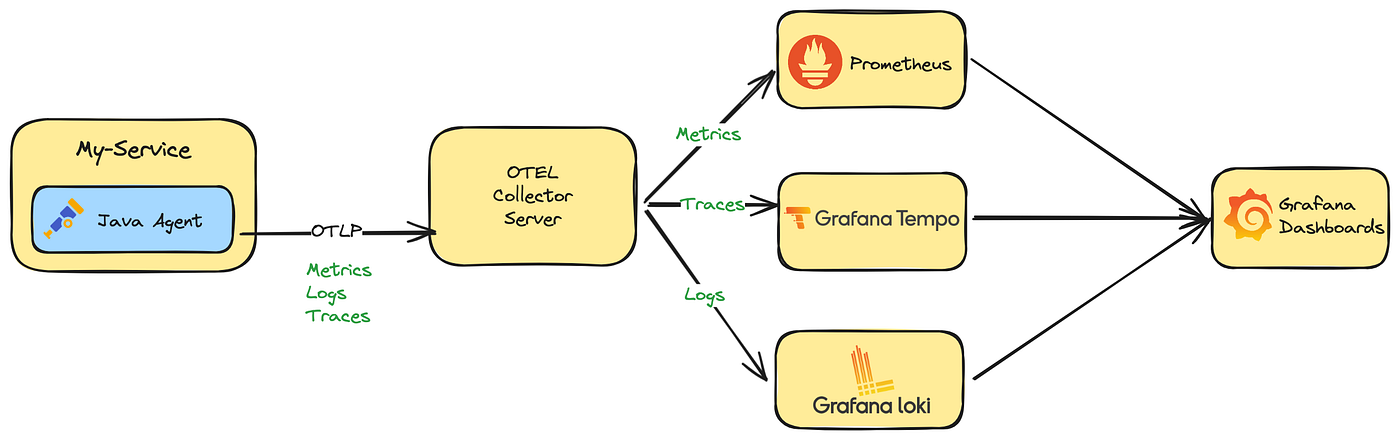
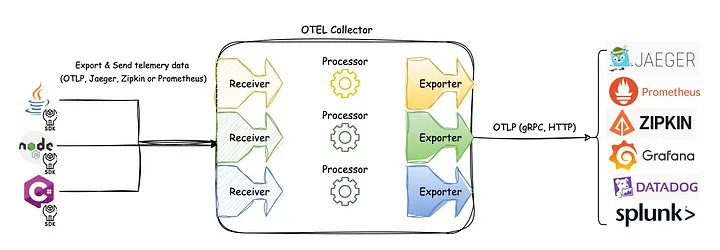
Send telemetry to an OpenTelemetry Collector
- The OpenTelemetry Collector is a critical component of most production deployments.
- Some examples of when it’s beneficial to use a collector
- A single telemetry sink shared by multiple services, to reduce overhead of switching exporters
- Aggregating traces across multiple services, running on multiple hosts
- A central place to process traces prior to exporting them to a backend
- Unless you have just a single service or are experimenting, you’ll want to use a collector in production deployments.
Configure and run a local collector
1 | receivers: |
Then run the docker command to acquire and run the collector based on this configuration:
1 | docker run -p 4317:4317 \ |
You will now have an collector instance running locally, listening on port 4317.
Modify the command to export spans and metrics via OTLP
- The next step is to modify the command to send spans and metrics to the collector via OTLP instead of the console.
- To do this, install the OTLP exporter package:
1 | pip install opentelemetry-exporter-otlp |
The opentelemetry-instrument agent will detect the package you just installed and default to OTLP export when it’s run next.
Run the application
Run the application like before, but don’t export to the console:
1 | export OTEL_PYTHON_LOGGING_AUTO_INSTRUMENTATION_ENABLED=true |
- By default, opentelemetry-instrument exports traces and metrics over OTLP/gRPC and will send them to localhost:4317
- which is what the collector is listening on.
Propagation
Automatic context propagation
- Instrumentation libraries for popular Python frameworks and libraries
- such as Jinja2, Flask, Django, and Celery.propagate context across services for you.
- Use instrumentation libraries to propagate context.
- Although it is possible to propagate context manually
- the Python auto-instrumentation and instrumentation libraries are well-tested and easier to use.
Distro
- In order to make using OpenTelemetry and auto-instrumentation as quick as possible without sacrificing flexibility
- OpenTelemetry distros provide a mechanism to automatically configure some of the more common options for users.
- By harnessing their power, users of OpenTelemetry can configure the components as they need.
- The opentelemetry-distro package provides some defaults to users looking to get started, it configures:
- the SDK TracerProvider
- a BatchSpanProcessor
- the OTLP SpanExporter to send data to an OpenTelemetry Collector
- The package also provides a starting point for anyone interested in producing an alternative distro.
- The interfaces implemented by the package are loaded by the auto-instrumentation
- via the opentelemetry_distro and opentelemetry_configurator entry points to configure the application before any other code is executed.
- In order to automatically export data from OpenTelemetry to the OpenTelemetry collector, installing the package will set up all the required entry points.
1 | pip install opentelemetry-distro[otlp] opentelemetry-instrumentation |
Zero-code Instrumentation
Overview
- Automatic instrumentation with Python uses a Python agent that can be attached to any Python application.
- This agent primarily uses monkey patching to modify library functions at runtime
- allowing for the capture of telemetry data from many popular libraries and frameworks.
Setup
Run the following commands to install the appropriate packages.
1 | pip install opentelemetry-distro opentelemetry-exporter-otlp |
- The
opentelemetry-distropackage installs the API, SDK, and theopentelemetry-bootstrapandopentelemetry-instrumenttools. - You must install a distro package to get auto instrumentation working.
- The opentelemetry-distro package contains the default distro to automatically configure some of the common options for users.
- The opentelemetry-bootstrap -a install command
- reads through the list of packages installed in your active site-packages folder,
- and installs the corresponding instrumentation libraries for these packages, if applicable.
- For example, if you already installed the flask package
- running opentelemetry-bootstrap -a install will install opentelemetry-instrumentation-flask for you.
- The OpenTelemetry Python agent will use monkey patching to modify functions in these libraries at runtime.
- Running opentelemetry-bootstrap without arguments lists the recommended instrumentation libraries to be installed.
Configuring the agent
- The agent is highly configurable.
- One option is to configure the agent by way of configuration properties from the CLI:
1 | opentelemetry-instrument \ |
Alternatively, you can use environment variables to configure the agent:
1 | OTEL_SERVICE_NAME=your-service-name \ |
Supported libraries and frameworks
A number of popular Python libraries are auto-instrumented, including Flask and Django.
Configuration
Configuration properties
Here’s an example of agent configuration via configuration properties:
1 | opentelemetry-instrument \ |
Here’s an explanation of what each configuration does:
- traces_exporter
- specifies which traces exporter to use.
- In this case, traces are being exported to console (stdout) and with otlp.
- The otlp option tells opentelemetry-instrument to send the traces to an endpoint that accepts OTLP via gRPC.
- In order to use HTTP instead of gRPC, add –exporter_otlp_protocol http/protobuf.
- metrics_exporter
- specifies which metrics exporter to use.
- In this case, metrics are being exported to console (stdout).
- It is currently required for your to specify a metrics exporter.
- If you aren’t exporting metrics, specify none as the value instead.
- service_name
- sets the name of the service associated with your telemetry, and is sent to your Observability backend.
- exporter_otlp_endpoint
- sets the endpoint where telemetry is exported to.
- If omitted, the default Collector endpoint will be used, which is 0.0.0.0:4317 for gRPC and 0.0.0.0:4318 for HTTP.
- exporter_otlp_headers
- is required depending on your chosen Observability backend.
Environment Variables
- In some cases, configuring via environment variables is more preferred.
- Any setting configurable with a command-line argument can also be configured with an Environment Variable.
- You can apply the following steps to determine the correct name mapping of the desired configuration property:
- Convert the configuration property to uppercase.
- Prefix environment variable with
OTEL_ - For example,
exporter_otlp_endpointwould convert toOTEL_EXPORTER_OTLP_ENDPOINT.
Python-specific Configuration
There are some Python specific configuration options you can set by prefixing environment variables with
OTEL_PYTHON_.
Excluded URLs
- Comma-separated regular expressions representing which URLs to exclude across all instrumentations:
OTEL_PYTHON_EXCLUDED_URLS
- You can also exclude URLs for specific instrumentations by using a variable
OTEL_PYTHON_<library>_EXCLUDED_URLS- where library is the uppercase version of one of the following:
- Django, Falcon, FastAPI, Flask, Pyramid, Requests, Starlette, Tornado, urllib, urllib3.
Examples
1 | export OTEL_PYTHON_EXCLUDED_URLS="client/.*/info,healthcheck" |
Request Attribute Names
Comma-separated list of names that will be extracted from the request object and set as attributes on spans.
- OTEL_PYTHON_DJANGO_TRACED_REQUEST_ATTRS
- OTEL_PYTHON_FALCON_TRACED_REQUEST_ATTRS
- OTEL_PYTHON_TORNADO_TRACED_REQUEST_ATTRS
Examples
1 | export OTEL_PYTHON_DJANGO_TRACED_REQUEST_ATTRS='path_info,content_type' |
Logging
There are some configuration options used to control the logs that are outputted.
| Key | Value |
|---|---|
| OTEL_PYTHON_LOG_CORRELATION | to enable trace context injection into logs (true, false) |
| OTEL_PYTHON_LOG_FORMAT | to instruct the instrumentation to use a custom logging format |
| OTEL_PYTHON_LOG_LEVEL | to set a custom log level (info, error, debug, warning) |
| OTEL_PYTHON_LOGGING_AUTO_INSTRUMENTATION_ENABLED | to enable auto-instrumentation of logs. Attaches OTLP handler to Python root logger. |
Examples
1 | export OTEL_PYTHON_LOG_CORRELATION=true |
Other
There are some more configuration options that can be set that don’t fall into a specific category.
| Key | Value |
|---|---|
| OTEL_PYTHON_DJANGO_INSTRUMENT | set to false to disable the default enabled state for the Django instrumentation |
| OTEL_PYTHON_ELASTICSEARCH_NAME_PREFIX | changes the default prefixes for Elasticsearch operation names from “Elasticsearch” to whatever is used here |
| OTEL_PYTHON_GRPC_EXCLUDED_SERVICES | comma-separated list of specific services to exclude for the gRPC instrumentation |
| OTEL_PYTHON_ID_GENERATOR | to specify which IDs generator to use for the global Tracer Provider |
| OTEL_PYTHON_INSTRUMENTATION_SANITIZE_REDIS | to enable query sanitization |
Examples
1 | export OTEL_PYTHON_DJANGO_INSTRUMENT=false |
Disabling Specific Instrumentations
- The Python agent by default will detect a Python program’s packages and instrument any packages it can.
- This makes instrumentation easy, but can result in too much or unwanted data.
- You can omit specific packages from instrumentation by using the OTEL_PYTHON_DISABLED_INSTRUMENTATIONS environment variable.
- The environment variable can be set to a comma-separated list of instrumentations entry point names to exclude from instrumentation.
- Most of the time the entry point name is the same as the package name and it is set in
- the project.entry-points.opentelemetry_instrumentor table in the package pyproject.toml file.
- For example, if your Python program uses the
redis,kafka-pythonandgrpcpackages- by default the agent will use the
opentelemetry-instrumentation-redis,opentelemetry-instrumentation-kafka-pythonandopentelemetry-instrumentation-grpcpackages to instrument them. - To disable this, you can set
OTEL_PYTHON_DISABLED_INSTRUMENTATIONS=redis,kafka,grpc_client.
- by default the agent will use the